Fig. 7
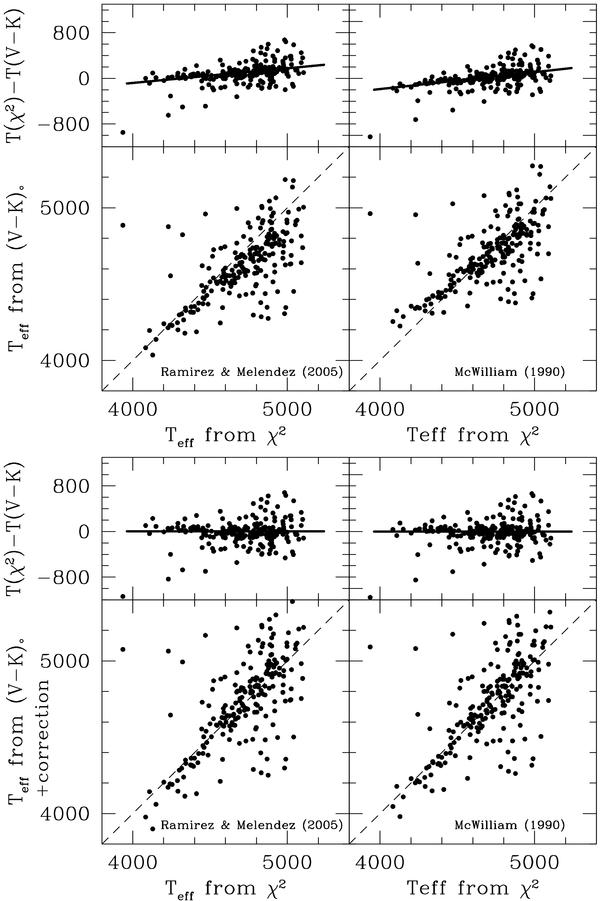
Comparison between our temperatures and those derived from the (V − K) color calibrations of Ramirez & Melendez (2005, left column) and McWilliam (1990, right column). Top panels: using original Teff/(V − K) relations. The dashed line is the 1:1 relation, the thick solid line the least squares fit. Bottom panels: as above but with corrected Teff/(V − K) relations as explained in the text (Sect 6.4 and Eqs. (4) and (5)).
Current usage metrics show cumulative count of Article Views (full-text article views including HTML views, PDF and ePub downloads, according to the available data) and Abstracts Views on Vision4Press platform.
Data correspond to usage on the plateform after 2015. The current usage metrics is available 48-96 hours after online publication and is updated daily on week days.
Initial download of the metrics may take a while.