Fig. 7
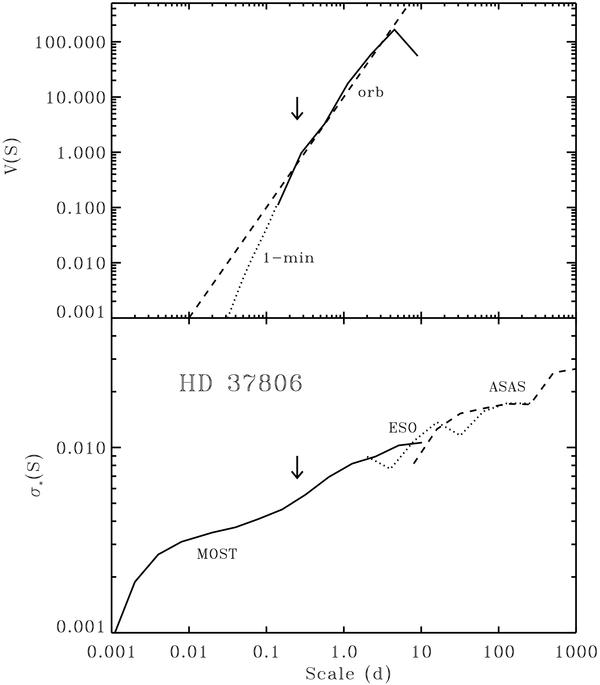
Upper panel: The scalegram for the 21 days of the MOST data for HD 37806 based on the DOG-2 wavelet (continuous line) for the data were sampled at the MOST orbital period of 0.07 d. The horizontal axis gives the time scale in days. Because only slope values and their changes are important here, the vertical scale has an arbitrary zero point. The broken line has slope 3 in log–log units. The dotted line gives the scalegram for the shortest time scales, based on 9.5 days of data sampled at one-minute intervals (see Fig. 8); it has been shifted vertically to match the results for the coarsely sampled data. The arrow points at time scales where visual inspection suggests appearance of coherent structures in the DOG-2 wavelet transform. Lower panel: The continuous line gives the median standard deviation σ ⋆ for the full set of the MOST data (sampled at one minute), calculated for progressively longer time scales and corrected for the observational random error of σR = 0.0028, as described in the text. The dotted and broken lines give the ESO and the ASAS median dispersions at a given scale, corrected for observational errors σR of 0.007 and 0.017, respectively.
Current usage metrics show cumulative count of Article Views (full-text article views including HTML views, PDF and ePub downloads, according to the available data) and Abstracts Views on Vision4Press platform.
Data correspond to usage on the plateform after 2015. The current usage metrics is available 48-96 hours after online publication and is updated daily on week days.
Initial download of the metrics may take a while.