Fig. 4
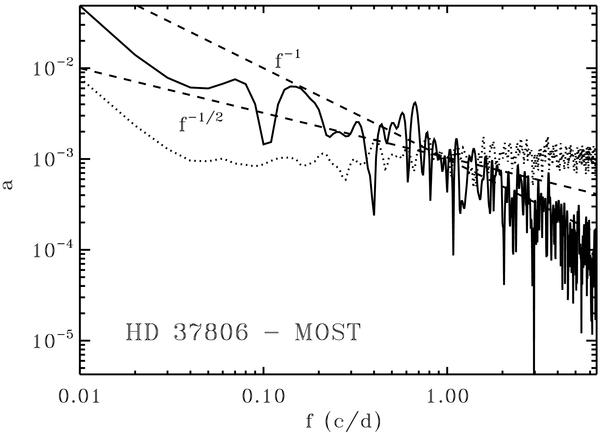
The amplitude spectrum of the MOST variability data for HD 37806 is shown by the continuous line. The dotted line gives the Fourier amplitude errors estimated by a bootstrap re-sampling experiment. The broken lines, shown to guide the eye, give the slopes of a ∝ 1 / f and  ; the latter corresponds to “flicker noise” (Press 1978).
Current usage metrics show cumulative count of Article Views (full-text article views including HTML views, PDF and ePub downloads, according to the available data) and Abstracts Views on Vision4Press platform.
Data correspond to usage on the plateform after 2015. The current usage metrics is available 48-96 hours after online publication and is updated daily on week days.
Initial download of the metrics may take a while.