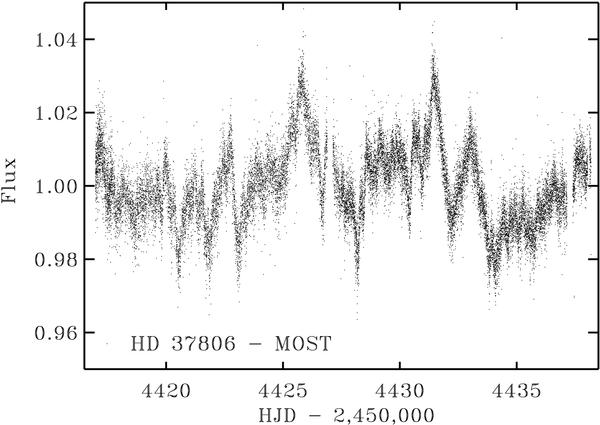
Fig. 3

The MOST light curve of HD 37806, covering 21 days, expressed in units of the mean flux, with one-minute sampling. The first half of the run experienced gaps of about 30% of each 103 min satellite orbit due to a high background level. The data set has been used at the full one-minute resolution as well as at the uniform, MOST-orbit time sampling necessary for the wavelet analysis (see Sect. 3.2.)
Current usage metrics show cumulative count of Article Views (full-text article views including HTML views, PDF and ePub downloads, according to the available data) and Abstracts Views on Vision4Press platform.
Data correspond to usage on the plateform after 2015. The current usage metrics is available 48-96 hours after online publication and is updated daily on week days.
Initial download of the metrics may take a while.


