Fig. 2
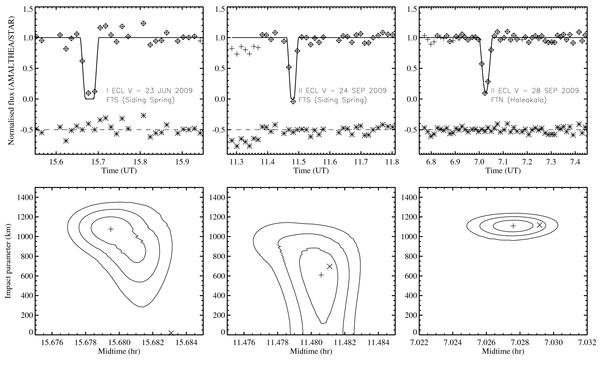
Model
fits to our data. Upper panels: best fit models (black curves) to
the observations (“+” signs surrounded by diamonds). Fit residuals are represented
by asterisks. Lower panels: parametric contour plots of the reduced
chi squared goodness-of-fit statistic ( ). Contours at the
1σ, 2σ, and 3σ levels are
plotted. The best fit value is indicated by a “+” sign while the ephemeris
prediction is indicated by a cross.
). Contours at the
1σ, 2σ, and 3σ levels are
plotted. The best fit value is indicated by a “+” sign while the ephemeris
prediction is indicated by a cross.
Current usage metrics show cumulative count of Article Views (full-text article views including HTML views, PDF and ePub downloads, according to the available data) and Abstracts Views on Vision4Press platform.
Data correspond to usage on the plateform after 2015. The current usage metrics is available 48-96 hours after online publication and is updated daily on week days.
Initial download of the metrics may take a while.