| Issue |
A&A
Volume 522, November 2010
|
|
|---|---|---|
| Article Number | A20 | |
| Number of page(s) | 8 | |
| Section | Extragalactic astronomy | |
| DOI | https://doi.org/10.1051/0004-6361/201014801 | |
| Published online | 27 October 2010 | |
The afterglow and host galaxy of GRB 090205: evidence of a Ly-α emitter at z = 4.65⋆
1
INAF-Osservatorio Astronomico di Brera, via Bianchi 46
23807
Merate
Italy
e-mail: This email address is being protected from spambots. You need JavaScript enabled to view it.
2
ASI Science Data Center, via Galileo Galilei,
00044
Frascati,
Italy
3
Università degli Studi dell’Insubria, Dipartimento di Fisica e
Matematica, via Valleggio
11, 22100
Como,
Italy
4
Università degli Studi di Milano-Bicocca, Dipartimento di
Fisica, piazza delle Scienze
3, 20126
Milano,
Italy
5
Department of Astronomy and Astrophysics, Pensylvania State
University, 525 Davey
Lab, University
Park, PA
16802,
USA
6 Center for Particle Astrophysics, Pensylvania State
University, USA
7
Purple Mountain Observatory, Chinese Academy of Sciences,
Nanjing
210008, PR
China
8
Instituto de Física de Cantabria (CSIC-UC),
39005
Santander,
Spain
9 The George Washington University, Washington, D.C., 20052,
USA
10
NASA/Goddard Space Flight Center, Greenbelt, MD
20771,
USA
11 Department of Physics, Pensylvania State University, USA
12
Department of Physics and Astronomy, University of
Nevada, Las Vegas,
NV
89154,
USA
13
INAF-Osservatorio Astronomico di Roma, via di Frascati 33, 00040
Monteporzio Catone, Roma, Italy
14
INAF-Osservatorio Astronomico di Capodimonte, salita Moiariello
16, 80131
Napoli,
Italy
15
International Center for Relativistic Astrophysics, piazza della
Repubblica 10, 65122
Pescara,
Italy
Received:
15
April
2010
Accepted:
28
May
2010
Abstract
Context. Gamma-ray bursts (GRBs) have proven to be detectable to distances much larger than any other astrophysical object, providing the most effective way, complementing ordinary surveys of studying the high redshift universe.
Aims. We present the results of an observational campaign devoted to the study of the high-z GRB 090205.
Methods. We carried out optical/NIR spectroscopy and imaging of GRB 090205 with the ESO-VLT starting from hours after the event to several days later to detect the host galaxy. We compared the results obtained from our optical/NIR observations with the available Swift high-energy data of this burst.
Results. Our observational campaign led to the detection of the optical afterglow and host galaxy of GRB 090205 and to the first measure of its redshift, z = 4.65. As in other high-z GRBs, GRB 090205 has a short duration in the rest frame with T90,rf = 1.6 s, which suggests that it might belong to the short GRB class. The X-ray afterglow of GRB 090205 has a complex and interesting behavior with a possible rebrightening at 500–1000 s from the trigger time and late flaring activity. Photometric observations of the GRB 090205 host galaxy imply that it is a starburst galaxy with a stellar population younger than ~150 Myr. Moreover, the metallicity of Z > 0.27Z⊙ derived from the GRB afterglow spectrum is among the highest derived from GRB afterglow measurement at high-z, suggesting that the burst occurred in a rather enriched environment. Finally, a detailed analysis of the afterglow spectrum shows the existence of a line corresponding to Lyman-α emission at the redshift of the burst. GRB 090205 is thus hosted by a typical Lyman-α emitter (LAE) at z = 4.65. This makes the host galaxy of GRB 090205 the farthest GRB host galaxy, spectroscopically confirmed, detected to date.
Key words: gamma rays: general
The results reported in this paper are based on observations carried out at ESO telescopes under programmes Id 082.A-031 and 283.D-5033.
© ESO, 2010
1. Introduction
Gamma-ray bursts (GRBs) are powerful flashes of high-energy photons occurring at an average rate of a few per day throughout the Universe. Thanks to their optical brightness that typically overshines the luminosity of their host galaxy, they are detectable out to extremely high redshift, as clearly shown by the detection of GRB 090423 at z ~ 8.2 (Salvaterra et al. 2009; Tanvir et al. 2009). This has strengthened the idea that GRBs can be used as a tool to study the Universe up to (and beyond) the reionization epoch. Indeed, GRBs can be used to identify high-z galaxies and study their metal and dust content by identifying metal absorption lines in their optical afterglow.
Two classes of GRBs, short and long, have been identified on the basis of their observed duration (shorter or longer than ~2 s) and spectral hardness (Kouveliotou et al. 1993). Analyses of observations by the Swift satellite have questioned this simple scheme and called for a classification invoking multiple observational criteria (see Zhang et al. 2009). To this end, prompt emission properties such as the isotropic gamma-ray energy release (Eγ,iso) and the peak energy (Ep) seem to provide promising tools for GRB classification, as shown by the Ep,i − Eγ,iso correlation (Amati et al. 2008) and its derivations (see, e.g., Lv et al. 2010, and references therein). While it is widely believed that the majority of long GRBs originate from the collapse of massive stars, the nature of the progenitors of short ones is still unclear, though likely linked to the merger of two compact objects. Long GRBs are typically found to be hosted in low-mass, blue galaxies with high specific star formation rates (SSFR), whereas short GRBs are generally hosted in more heterogeneous types of galaxies, at least some with lower SSFR (see e.g., Fruchter et al. 2006; Berger 2009; Savaglio et al. 2009; Fong et al. 2010).
In this paper, we report the detection of GRB 090205 at z = 4.65 and the study of the properties of its host galaxy, a young starburst. The paper is organized as follows. In Sect. 2, we report the detection of GRB 090205 by Swift (Sect. 2.1) and the discovery and study of its optical afterglow and host galaxy (Sect. 2.2). A discussion about the nature of the burst is given in Sect. 3.1, whereas the interpretation of its afterglow is reported in Sect. 3.2. In Sect. 3.3, we discuss the nature of the host galaxy of GRB 090502 and finally, we briefly summarize our main conclusions in Sect. 4.
The standard cosmological parameters (h = 0.71, Ωm = 0.27, ΩΛ = 0.73) are assumed and magnitudes are given in the AB system. All errors are at the 90% confidence level, unless stated otherwise.
2. Observations
2.1. Swift observation
GRB 090205 triggered Swift-BAT (Perri et al. 2009) on 2009 Feb. 5 at 23:03:14 UT (hereafter, T0). The mask-weighted light curve shows a single peak starting at T0 − 5 s, peaking at T0 + 3 s, and returning to the background level at T0 + 10 s (Fig. 1). The duration of the prompt emission is T90 = 8.8 ± 1.8 s in the 15–150 keV band. The time-averaged spectrum from T0 − 2.9 s to T0 + 6.6 s in the 15–150 keV band can be fit by a simple power-law model with photon index Γ = 2.15 ± 0.23. Alternatively, an equally good fit can be obtained by using a cut-off power-law model with photon index a = 0.8 ± 1.3 and observed peak energy Ep = 34 ± 15 keV. A peak energy of ~30 keV is also found from the relation between Ep and Γ obtained by Sakamoto et al. (2009). The fluence in the 15–150 keV band is Fγ = (1.9 ± 0.3) × 10-7 erg cm-2 and the 1-s peak photon flux measured from T0 + 4.09 s in the 15–150 keV band is P = 0.5 ± 0.1 ph cm-2 s-1 (Cummings et al. 2009). Following the method described in Ukwatta et al. (2010), we performed the spectral lag analysis of the BAT data from T0 − 20 s to T0 + 20 s in four energy bands (12–25 keV, 25–50 keV, 50–100 keV, 100–350 keV) with a time bin of 1024 ms. All lags are consistent with zero, but have relatively large uncertainties, given the faintness of the prompt emission. Swift-XRT began to observe the field of GRB 090205 at ~89 s after the trigger, identifying a fading uncatalogued X-ray source located at the UVOT-enhanced position of RA (J2000) = 14h43m38.69s and Dec (J2000) = –27d51′09.6′′ with an uncertainty of 1.8′′ (radius, 90% confidence, Evans et al. 2009). Swift-UVOT began settled observations of the field of GRB 090205 92 s after the BAT trigger, but no source was identified at the enhanced Swift XRT position. The burst was declared a “burst of interest” by Gehrels & Perri (2009).
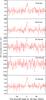 |
Fig. 1 Four channels and combined BAT mask-weighted light curve of GRB 090205. Bin size is 1024 ms. |
2.1.1. XRT temporal and spectral analysis
The XRT data were processed with the XRTDAS software package (v. 2.5.0) developed at
the ASI Science Data Center (ASDC) and distributed by HEASARC within the HEASOFT package
(v. 6.7). Event files were calibrated and cleaned with standard filtering criteria with
the xrtpipeline task using the latest calibration files available in
the Swift CALDB. The X-ray light curve (Fig. 2) has
a complex behavior. At ~T0 + 500 s, we note a possible
rebrightening, while flaring activity is present at both
~T0 + 6 ks and ~T0 + 20
ks. A fit with a double broken power law
(F(t) ∝ t − α)
gives indices  for
t < T0 + tb,1,
for
t < T0 + tb,1,
 for
T0 + tb,1 < t < T0 + tb,2,
and
for
T0 + tb,1 < t < T0 + tb,2,
and  for
t > T0 + tb,2
(excluding the flaring activity), where
for
t > T0 + tb,2
(excluding the flaring activity), where  s and
s and
 s. We performed a
time-resolved spectral analysis of the X-ray afterglow during the first Swift orbit
(spanning from T0 + 100 s to
T0 + 2 ks) in three different time intervals: (i)
t < 470 s (initial decay); (ii) 470 s
< t < 1039 s (rise
phase of the rebrightening episode); and (iii)
1039 s < t < 2000 s
(decay phase of the rebrightening episode). For all the three intervals, the X-ray
spectrum is closely fitted by an absorbed power-law with photon index
ΓX ~ 2.0
(ΓX,1 = 1.84 ± 0.23, ΓX,2 = 2.00 ± 0.24, ΓX,3 = 2.14 ± 0.20)
and Galactic NH ~ 8 × 1020 cm-2, i.e.,
no spectral evolution is observed during the first orbit, although the data are
compatible with a gradual softening of the spectrum. No evidence of intrinsic absorption
at the redshift of the burst is found. The 2(3)-σ upper limit is
NH, z < 2.3(3.5) × 1022 cm-2.
These limits are obtained using the entire XRT dataset (i.e. using
T0 + 100 s – T0 + 83 ks data).
The time-resolved spectral analysis of the X-ray flaring activity was also obtained. The
first time interval showing variability (from T0 + 5179 s
to T0 + 7696 s) is well fitted by an absorbed power law with
photon index ΓX = 2.38 ± 0.21 and Galactic
NH ~ 8 × 1020 cm-2, while for the
second time interval (from T0 + 16782 s to
T0 + 25067 s), there is some evidence of a harder spectrum
with ΓX = 1.56 ± 0.35. We note, however, that during this flaring activity
the photon index values are consistent (at the 90% CL) with the values measured at
earlier times.
s. We performed a
time-resolved spectral analysis of the X-ray afterglow during the first Swift orbit
(spanning from T0 + 100 s to
T0 + 2 ks) in three different time intervals: (i)
t < 470 s (initial decay); (ii) 470 s
< t < 1039 s (rise
phase of the rebrightening episode); and (iii)
1039 s < t < 2000 s
(decay phase of the rebrightening episode). For all the three intervals, the X-ray
spectrum is closely fitted by an absorbed power-law with photon index
ΓX ~ 2.0
(ΓX,1 = 1.84 ± 0.23, ΓX,2 = 2.00 ± 0.24, ΓX,3 = 2.14 ± 0.20)
and Galactic NH ~ 8 × 1020 cm-2, i.e.,
no spectral evolution is observed during the first orbit, although the data are
compatible with a gradual softening of the spectrum. No evidence of intrinsic absorption
at the redshift of the burst is found. The 2(3)-σ upper limit is
NH, z < 2.3(3.5) × 1022 cm-2.
These limits are obtained using the entire XRT dataset (i.e. using
T0 + 100 s – T0 + 83 ks data).
The time-resolved spectral analysis of the X-ray flaring activity was also obtained. The
first time interval showing variability (from T0 + 5179 s
to T0 + 7696 s) is well fitted by an absorbed power law with
photon index ΓX = 2.38 ± 0.21 and Galactic
NH ~ 8 × 1020 cm-2, while for the
second time interval (from T0 + 16782 s to
T0 + 25067 s), there is some evidence of a harder spectrum
with ΓX = 1.56 ± 0.35. We note, however, that during this flaring activity
the photon index values are consistent (at the 90% CL) with the values measured at
earlier times.
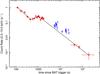 |
Fig. 2 X-ray light curve in count rate. The solid line shows the best-fit power law obtained excluding the flaring activity (marked by open circles) present at ~T0 + 6 ks and ~T0 + 20 ks, respectively. The conversion factor is 1 cts s-1 = 3.6 × 10⁻¹¹ erg cm-2 s-1. Errors are at 68% c.l. |
2.2. Optical/NIR observations
A complete log of all our optical/NIR ground based observations is reported in Table 1.
VLT observation log for GRB 090205.
2.2.1. Optical/NIR imaging
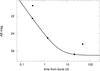 |
Fig. 3 Optical R- (dots) and I-band (squares) afterglow light curve. The solid line shows the best-fit power law. Magnitude are in AB system and are not corrected for Galactic extinction. Errors are at 68% c.l. |
We observed the field of GRB 090205 with the ESO-VLT in imaging mode starting about 7.1 h after the burst. Observations were carried out in R and I − band with the FORS1 camera. Within the enhanced X-ray position, we identified a source at the coordinates RA(J2000) = 14h43m38.70s and Dec(J2000) = –27d51′10.0′′ with an uncertainty of 0.3′′ (D’Avanzo et al. 2009a). The source is detected in both bands with RAB = 22.26 ± 0.04 and IAB = 20.80 ± 0.02, the red color implying that it is a high redshift object. All values given here are not corrected for a Galactic dust extinction of E(B − V) = 0.117 (Schlegel et al. 1998). This result was confirmed by almost contemporaneous GROND observations (Kruehler & Greiner 2009): the object is very well detected in the i′-band, marginally in the r′-band and not in the g′-band. Interpreting the non-detection in the g′-band and the relatively red r′ − i′ color as being caused by intrinsic Lyman-α absorption in the GRB host, a photometric redshift of 4.7 ± 0.3 was derived.
We continued to monitor the fading of the GRB afterglow with the FORS1 camera on VLT. A
second epoch image was obtained ~1.34 days after the trigger in the
R-band (D’Avanzo et al. 2009b).
The source was detected with RAB = 24.51 ± 0.18. Its fading
behavior confirms it to be the optical afterglow of GRB 090205. Late-time, multiband
observations were also carried out to search for the GRB host galaxy, showing a
flattening in the R and, possibly, in the I-band light
curves (see Sect. 2.2.3). Assuming a power-law
decay
F(t) = F0 + kt − α,
the decay index is  , steeper
(but consistent within the errors) than the decay index derived from the X-ray light
curve at the same epochs. A plot of our R- and I-band
observations is shown in Fig. 3.
, steeper
(but consistent within the errors) than the decay index derived from the X-ray light
curve at the same epochs. A plot of our R- and I-band
observations is shown in Fig. 3.
2.2.2. Spectroscopic observations
We observed the source with the ESO VLT about 9.0 h after the burst with the FORS1 camera in spectroscopic mode. We took a 20 min spectrum with the 300V grism (11 Å FWHM) using a slit with 1′′ width. We covered a wavelength range of 4000–10 000 Å with a resolution of R = 440 (Thöne et al. 2009; Fugazza et al. 2009). The spectrum was reduced with standard tasks in IRAF and combined and flux-calibrated using observations of the standard star EG274 taken on Feb. 7, 2009.
The most prominent feature in the spectrum is the damped Lyman alpha system (DLA) at 6873 Å in the observer frame. Furthermore, we detected Ly-β and Ly-γ in absorption as well as the Lyman break. Redwards of the DLA, we detected a range of absorption lines from the host galaxy, SII, SiII, CII, SiIV, and CIV (see Table 2). We also detected the fine structure transition of SiII* λ 1264 Å, but no other fine structure lines could be identified. From those lines, we determined the redshift of the GRB to be z = 4.6503 ± 0.0025. A plot of the combined spectrum with the lines identified is shown in Fig. 4. A detailed analysis of the spectrum identifies an emission line at ~6873 Å (Fig. 5) that, at the redshift of the GRB, corresponds to Ly-α emission at 1215 Å. We discuss this in more detail in the next section.
We fitted the red wing of the DLA using the MIDAS fitlyman package. The resulting column density was determined to be log NH/cm-2 = 20.73 ± 0.05. The HI column density lies below the average neutral hydrogen column density for GRB-DLAs of log NH/cm-2 = 21.6 (Jakobsson et al. 2006; Fynbo et al. 2009). This agrees with the simulations of Nagamine et al. (2008), which show that the mean DLA column density decreases with increasing redshift. On the other hand, the relatively low number of GRBs at redshift ≥ 3 − 4 with measured HI column density and the probable observational bias against the most dusty environments (Jakobsson et al. 2006; Fynbo et al. 2009) do not enable us yet to firmly check the existence of this anticorrelation.
The majority of the absorption lines detected are saturated and therefore do not allow us to perform a reliable determination of the column density. Mildly saturated lines, which we define here as lines with an EW of < 0.5 Å, do not lie on the linear part of the curve of growth and the derived column densities can only be considered as lower limits. For SII, SiII*, and OI (EWs from 0.30 to 0.49, Table 2) we obtain, assuming a linear relation between the EW and the column density, log N/cm-2 = 15.3, log N/cm-2 = 13.4, and log N/cm-2 = 14.8, respectively. We take the column density limit derived from SII to determine the metallicity of the host as SII is not affected by depletion onto dust. Using the solar abundances reported in Asplund et al. (2009), we find the metallicity in the host along the line of sight to be [M/H] > − 0.57 or Z > 0.27Z⊙.
Measured wavelengths, derived redshift, and equivalent widths (EWs) of detected absorption lines
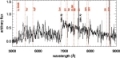 |
Fig. 4 VLT/FORS1 spectrum of the GRB 090205 afterglow at z = 4.6503 ± 0.0025. |
2.2.3. Host galaxy observations
We continued to monitor the field of GRB 090205 at late times to study the GRB host in greter detail. We obtained an image in the R-band with the FORS1 camera ~ 20.3 days after the trigger. A faint object at a magnitude of RAB ~ 26.4 ± 0.3 was identified very close to the position of the GRB afterglow. This detection represents a flattening in the R-band light curve, which we interpret as being caused by the host galaxy (Fig. 3). Further I-band monitoring, carried out ~46.3 days after burst1, reveals an object with IAB = 25.2 ± 0.1. Comparing this detection with the previous one obtained in the R-band, the resulting unabsorbed R − I color is consistent with that of the afterglow. This suggests a flattening of the light curve in the I-band too, in agreement with the hypothesis that we detected the host galaxy of GRB 090205. We also carried out deep, late-time (t − T0 ~ 180 d) NIR observations of the field of GRB 090205 with VLT/HAWK-I in JHK-bands. The host is not detected in any of the observed bands up to limiting AB magnitudes of J > 24.4, H > 24.2, and Ks > 23.9 (3σ c.l.). The results are reported in Table 1 and in Figs. 6, 7.
As already mentioned, the afterglow spectrum contains an emission line at ~ 6873 Åsuperimposed on the Ly-α absorption, corresponding to Ly-α emission at the same redshift of the GRB. To check the reliability of this line detection and exclude the possibility that it is due to some atmospheric emission or contaminating absorption line, we performed a detailed analysis of the 2D spectrum (see Fig. 5). At the wavelength corresponding to the Ly-α line emission, we measured 2101 ± 51 counts (sky+object). The counts corresponding only to sky are 1836 ± 21, so that the object counts are 265 ± 55 (68% c.l.). The corresponding signal-to-noise ratio is 5.2. Another important result obtained for the 2D spectrum is the measure of a spatial displacement of 1.3 ± 0.9 pixels (equivalent to 0.3′′ ± 0.2′′) between the centroid of the afterglow continuum trace and the “spot” corresponding to the Ly-α emission (see Fig. 5). By performing precise astrometry on our afterglow and host galaxy images obtained with FORS1, we measured the same offset between the afterglow and the host galaxy positions (0.4′′ ± 0.3′′, corresponding to a physical offset of about 3 kpc), thus strengthening the hypothesis that this spectral line is really produced by Ly-α emission from the host galaxy. Using the flux-calibrated afterglow spectrum, we derived a flux of 1.82 × 10⁻¹⁷ erg s-1 cm-2. This flux transforms into a Ly-α luminosity of 4.27 × 1042 erg s-1. We note that this value is in the range of luminosities observed for the other GRB-LAE hosts2, i.e. 1 − 5 × 1042 erg s-1 (Jakobsson et al. 2005).
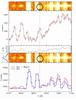 |
Fig. 5 Detailed analysis of the Ly-α emission line detection. The top panel shows the blow up of the region centered on the Ly-α emission at 6873.45 Å (dashed line), corresponding to 1215.67 Å in the emitter rest frame. The central panel shows the corresponding signal-to-noise ratio. The bottom panel reports the counts from the sky (blue line) and for the sky+object (red line). The position of the Ly-α emission in the 2D spectrum (shown in both panels), is marked by a circle and has an offset with respect to the afterglow continuum (corresponding to 0.3′′; see Sect. 2.2.3 for details). |
3. Discussion
3.1. Burst classification
One interesting aspect of this burst is that, as for to other high-z GRBs (e.g. GRB 080913 at z = 6.7, Greiner et al. 2009; GRB 090423 at z = 8.2, Salvaterra et al. 2009; Tanvir et al. 2009), it has a short duration in the emitter rest-frame, T90,rf ~ 1.6 s. A short rest-frame duration was proposed as an indicator (among others) of GRBs that originated from a compact-star-merger progenitor (or type I GRBs, Zhang et al. 2009). While the spectral lag analysis is inconclusive regarding the nature of this burst, owing to the faintness of the prompt emission (Sect. 2.1), the BAT spectrum appears to be softer than typical short GRBs. At z = 4.65, the isotropic gamma-ray energy release in the redshifted 15–150 keV band is Eγ,iso = 7.86 ± 1.21 × 1051 erg and the intrinsic peak energy is Ep,i = 192 ± 85 keV. These values make GRB 090205 consistent with the observed Ep,i − Eγ,iso correlation (Amati et al. 2008), which is known to be followed only by long GRBs (see also Piranomonte et al. 2008) and proposed as an indicator of GRBs with a massive stellar collapse origin (type II GRBs, Zhang et al. 2009). The Ep,i − Eγ,iso correlation has indeed been used to support the long classification of a few rest-frame short duration bursts such as GRB 090423 (Salvaterra et al. 2009) and GRB 090426 (Antonelli et al. 2009). A type II classification for GRB 090205 is also supported by applying the classification method reported in Lv et al. (2010), which implies that ϵ = Eγ,iso,52 / Ep,z,25 / 3 ~ 0.26, where Eγ,iso,52 = Eγ,iso / 1052 erg and Ep,z,2 = Ep(1 + z) / 102 keV. This value places GRB 090205 in the high-ϵ regime, which is related to long (type II) GRBs.
In conclusion, even if a massive stellar collapse origin of GRB 090205 appears puzzling (although not unheard of)3 in the light of its rest-frame short duration, the prompt emission properties of this GRB are consistent with a type II classification. Furthermore, we note that, while the existence at high-z of a population of bursts originating from the merging of double compact objects is expected on theoretical grounds (Belczynski et al. 2010), their detection would imply that the short burst population has a very flat luminosity function, in contrast to the results of the analysis of BATSE and Swift data by Salvaterra et al. (2008).
3.2. Afterglow theoretical interpretation
As shown in Sect. 2.1, the X-ray afterglow evolution can be divided into three stages.
The closure relation for the first stage is 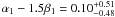 , which cannot
constrain any model because of the large scatter of the error bars. The closure relation
for the third stage is
α3 − 1.5β3 = − 0.56 ± 0.31, quite
consistent with the theoretical expectation of
α − 1.5β = − 0.5, where
α = (3p − 2) / 4 and
β = p / 2. Therefore, for
t > 103 s, the inferred power-law
index of the electron energy distribution shaped by shock acceleration is
, which cannot
constrain any model because of the large scatter of the error bars. The closure relation
for the third stage is
α3 − 1.5β3 = − 0.56 ± 0.31, quite
consistent with the theoretical expectation of
α − 1.5β = − 0.5, where
α = (3p − 2) / 4 and
β = p / 2. Therefore, for
t > 103 s, the inferred power-law
index of the electron energy distribution shaped by shock acceleration is
 . Therefore,
the simplest forward shock model for the first and third stages corresponds to the X-ray
band being above the cooling and typical frequencies of synchrotron radiation, i.e.,
νx > max(νm,νc).
. Therefore,
the simplest forward shock model for the first and third stages corresponds to the X-ray
band being above the cooling and typical frequencies of synchrotron radiation, i.e.,
νx > max(νm,νc).
The second stage shows a rise in the X-ray flux with time. Interpreting this as due to
the emergence of the synchrotron-self-Compton component in the X-ray band, there should be
significant spectral hardening around the transition time t ~ 500 s,
which conflicts with what we observed. Alternatively, the rise may be due to the
continuous energy injection
(Linj ∝ t − q)
from late-time central engine activities (e.g., Dai & Lu 1998) or refreshed shock (Rees & Meszaros 1992) by a late-time ejecta with varying Lorentz factors within the
ejecta
(M(>Γ) ∝ Γ − s).
Since the X-ray spectral index in the rising phase is steep, the characteristic
frequencies νc and νm should be
below the X-ray band. In accordance with Table 2 of Zhang et al. (2006), we used the relation of
α2 = (q − 2) / 2 + (q + 2)β2 / 2
and found that  , where
 and
β2 = 1.00 ± 0.24. For the matter-dominated injection model,
and
β2 = 1.00 ± 0.24. For the matter-dominated injection model,
 for the ISM case
and
for the ISM case
and 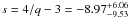 for the wind case.
Since s < 0 is unphysical, the wind model is
therefore excluded if the rebrightening is produced by a matter-dominated refreshed shock.
The afterglow kinetic energy after the rising phase is increased by a factor of
for the wind case.
Since s < 0 is unphysical, the wind model is
therefore excluded if the rebrightening is produced by a matter-dominated refreshed shock.
The afterglow kinetic energy after the rising phase is increased by a factor of
 .
.
The X-ray afterglow clearly exhibits late-time temporal variability (4ks < t < 20 ks). The variable afterglow is characterised by a flux contrast ΔF / F ~ 3, where ΔF is the flux enhancement due to the possible flares and F is the flux level of the underlying continuum. This and the upper limit to the variability ratio Δt / t < 0.3, places the possible GRB 090205 X-ray flares at the boundary between density fluctuations produced by many regions viewed off-axis and refreshed shocks (see Ioka et al. 2005; Chincarini et al. 2007, their Fig. 15). However, the low quality of our data statistics prevents us from drawing quantitative conclusions about both the temporal (see Chincarini et al. 2010, for an updated analysis of 113 GRB X-ray flares) and spectral behavior of this possible flaring activity (2007).
The Galactic-extinction-corrected I-band flux density at t ~ 25 ks was ~ 21.4 μJy. At this time, the 0.3–10 keV count rate is ~ 6.3 × 10⁻³ counts s-1, corresponding to a flux of 2.3 × 10⁻¹³ erg cm-2 s-1. For the late-time X-ray spectral index of β3 = 1.07, the X-ray flux density at νX = 1018 Hz is ~ 6.2 × 10⁻³ μJy. The near-infrared to X-ray overall spectral index at t ~ 25 ks is therefore βNIR − X ~ 1.0, which implies that the optical/NIR and the X-ray emission have the same origin.
In conclusion, the X-ray and optical afterglow can be explained by the standard forward shock model with νc,νm < νopt, and νX. The early rebrightening of the X-ray afterglow may be caused by an energy injection into the forward shock by the central engine. We note that more complex modeling of the rebrightening phase (i.e. two-component models) are not strictly required by the data.
3.3. GRB host
Our photometric campaign carried out with VLT/FORS, ISAAC, and HAWK-I (see Sect. 2.2.3) has allowed us to detect the GRB host galaxy in the R and I band and to place strong upper limits on the continuum in the NIR bands (J, H, and K). The observed magnitude and limits are reported in Table 1 and shown in Figs. 6 and 7. The blue color, (I − K)AB < 1.1, indicates that it is a starburst galaxy, whereas either an elliptical, Sab or Scd type of galaxy is discarded (see Fig. 6). We therefore modeled the photometric data with a family of synthetic starburst SEDs computed by using the output of the Starburst99 code (Leitherer et al. 1999; Vazquez & Leitherer 2005). We adopted a Salpeter initial mass function in the mass range 0.1–100 M⊙ and a metallicity of Z = 0.4Z⊙ which is consistent with the metallicity obtained from the GRB afterglow spectrum. Different stellar population ages are considered and the synthetic SEDs are normalized to reproduce the observed magnitude in the I-band. The absorption due to the intergalactic medium shortwards of the Ly-α line was modeled as in Salvaterra & Ferrara (2003, see Sect. 2.2). The theoretical SEDs are shown in Fig. 7 from top to bottom for stellar ages of 500, 100, 50, and 10 Myr, respectively. We find that the magnitude limits in the NIR bands provide a strong limit to the age of the stellar population. In order not to exceed the J and K band upper limits, the stellar population should be younger than τ < 150 Myr. In this case, the corresponding stellar mass is M ⋆ < 5 × 10¹⁰M⊙, in agreement with the average mass of long GRB host galaxies (108.5 − 1010.3M⊙, Savaglio et al. 2009). We neglect here the presence of dust inside the host galaxy. However, we note that dust extinction may redden the host SED, strengthening our limits on the stellar age and mass.
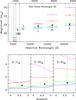 |
Fig. 6 Top panel: available data and expected magnitude of the GRB 090205 host for different galaxy types. The SEDs are normalized to reproduce the I band measure. Open circles (filled triangles) represent the data (upper limits), whereas the horizontal lines show the expected AB apparent magnitude of the object in the VRIJHK bands for different host galaxy types: magenta is for elliptical, red for Sab, yellow for Scd, green for irregular, cyan and blue for starburst galaxies. Vertical lines mark the position of the Lyman limit, and Lyβ and Ly-α lines (from left to right), respectively. Bottom panels: expected (I − J), (I − H), and (I − K) colors of the different galaxy types. Observational limit on the colors are plotted with triangles. |
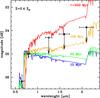 |
Fig. 7 Observations of the host galaxy of GRB 090205 shown with data points and upper limits are compared with synthetic SEDs for a starburst galaxy with different stellar ages τ. From top to bottom, lines corresponds to τ = 500, 100, 50, 10 Myr, respectively. We assume a Salpeter IMF between 0.1–100 M⊙, Z = 0.4Z⊙ and no dust extinction in the host galaxy. The SED are normalized to reproduce the observation in the I band. |
As described in Sect. 2.2.3, we found evidence that the host galaxy of GRB 090205 is a
Ly-α emitter. The Ly-α emission line corresponds to
z = 4.6537 ± 0.0014 which, compared to the redshift measured from the
absorption lines (Sect. 2.2.2), implies that
Δz = 0.0034 ± 0.0029(Δv = 180 ± 153 km
s-1). This agrees with the results obtained from spectroscopic studies
performed on large samples of Lyman break galaxies (LBG) at z ~ 3 that
show velocity offsets between the Ly-α emission and interstellar
absorption-line redshifts of the order of ~600 km s-1, with large dispersion
(~300 − 500 km s-1; see e.g. Adelberger et al. 2003; Shapley et al. 2003; Bielby
et al. 2010). These kinematics are usually
interpreted as being caused by large-scale outflows from by supernova-driven winds,
resulting from intense star formation, that blueshift absorption lines from the
interstellar gas. At the redshift of the burst, the Ly-α luminosity is
4.3 × 1042 erg s-1. This value is in the range of luminosities of
other LAEs identified by dedicated surveys at z ~ 4.5 (Finkelstein et al.
2007; Shioya et al. 2009; Wang et al. 2009). In
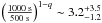
particular, Shioya et al. (2009), in a survey of
z ~ 4.8 LAEs in the COSMOS two square degree field, computed the
Ly-α luminosity function of these objects, measuring
 erg s-1. Similarly, Wang
et al. (2009) find
L ⋆ = 6.3 ± 1.5 × 1042 erg s-1
for a sample of 110 LAEs detected in the Large Area Lyman Alpha (LALA) survey. Our
findings imply that this particular burst exploded into a
0.6–0.7 L ⋆ LAE at this redshift.
Transforming the luminosity in a star-formation rate using the formula from 1998 for Hα and assuming a factor of 8
between Hα and Ly-α, we derived a SFR of
4.2 M⊙ yr-1, which is among the typical values
found for other Ly-α emitters hosting GRBs (see, e.g. Jakobsson et al.
2005) and typical galaxies hosting GRBs (Savaglio
et al. 2009). However, the above values should be
interpreted as lower limits. During the acquisition of the spectrum, the slit was centered
on the afterglow position, so that we lost part (about 50%) of the Ly-α
flux coming from the host galaxy, due to the 0.4′′ offset we discussed in
Sect. 2.2.3.
erg s-1. Similarly, Wang
et al. (2009) find
L ⋆ = 6.3 ± 1.5 × 1042 erg s-1
for a sample of 110 LAEs detected in the Large Area Lyman Alpha (LALA) survey. Our
findings imply that this particular burst exploded into a
0.6–0.7 L ⋆ LAE at this redshift.
Transforming the luminosity in a star-formation rate using the formula from 1998 for Hα and assuming a factor of 8
between Hα and Ly-α, we derived a SFR of
4.2 M⊙ yr-1, which is among the typical values
found for other Ly-α emitters hosting GRBs (see, e.g. Jakobsson et al.
2005) and typical galaxies hosting GRBs (Savaglio
et al. 2009). However, the above values should be
interpreted as lower limits. During the acquisition of the spectrum, the slit was centered
on the afterglow position, so that we lost part (about 50%) of the Ly-α
flux coming from the host galaxy, due to the 0.4′′ offset we discussed in
Sect. 2.2.3.
Our analysis of the GRB afterglow spectrum also provided a lower limit to the galaxy metallicity, Z ≥ 0.27Z⊙. Given the limit to the stellar mass obtained above, this metallicity is consistent with the mass-metallicity relation measured for Lyman break galaxies at z = 3 − 4 by Mannucci et al. (2009). We note however that the metallicity probed by absorption lines may not necessarily represent the metallicity of the entire GRB host, but more likely that of the line of sight towards the inner, star-forming region of the GRB host. The metallicity of GRB 090205 is among the highest determined for high-z GRBs. Comparing the metallicity of GRB 090205 to those determined for other GRBs at various redshifts, we find little or no evolution with redshift, in contrast to what has been found for the QSO-selected DLA population (Fynbo et al. 2006; Savaglio et al. 2009).
4. Conclusions
We have reported the detection and study of GRB 090205 at z = 4.65. As for other, high-z GRBs, GRB 090205 has a short duration in its rest-frame with T90,rf = 1.6 s. However, the analysis of its prompt emission properties has implied a massive stellar collapse origin. The X-ray afterglow of GRB 090205 exhibited a complex behavior with a possible rebrightening occurring at 500–1000 s from the trigger and flaring activity at later times. The X-ray and optical afterglow can be explained by the standard forward shock model with νc,νm < νopt, and νX, where the early rebrightening in the X-ray afterglow can be interpreted as due to the energy injection into the forward shock by the central engine.
Finally, we have reported the detection of the host galaxy of GRB 090205, which is found to be a typical LAE at z = 4.65, making it the farthest GRB host galaxy yet spectroscopically confirmed. The blue color is indicative of a starburst galaxy with a young (τ < 150 Myr) stellar population, which is consistent with the long classification of this GRB. The inferred mass and SFR are in line with typical values of GRB host galaxies, while the metallicity derived from the GRB afterglow spectrum is among the highest GRB afterglow measurements at high-z, suggesting that the burst occured in a rather enriched environment.
In conclusion, GRB 090205 clearly shows that GRBs can be used as signposts of young, starburst galaxies at high-z that are thought to be the dominant galaxy population at those epochs. Thanks to the brightness of their afterglow, metal lines can be easily identified providing, together with follow-up photometric observations of their host galaxies, a new way to measure the mass-metallicity relation and its evolution through cosmic time.
As reported in Table 1, another epoch of -band imaging was taken at d but, erroneously, no dithering was performed among different frames. The resulting image was thus highly affected by fringing (see http://www.eso.org/sci/facilities/paranal/instruments/fors/) and it was not possible to obtain reliable measures of photometry.
GRB 971214 (z = 3.42), GRB 000926 (z = 2.04), GRB 011211 (z = 2.14), GRB 021004 (z = 2.33), GRB 030323 (z = 3.37), and GRB 030429 (z = 2.66).
Despite their short rest-frame duration, the high- GRB 080913 and GRB 090423 were classified as type II bursts (Zhang et al. 2009).
Acknowledgments
We thank the referee for his/her useful comments and suggestions. We acknowledge support by ASI grant SWIFT I/011/07/0. This research has made use of the XRT Data Analysis Software (XRTDAS) developed under the responsibility of the ASI Science Data Center (ASDC), Italy. We acknowledge the invaluable help from the ESO staff at Paranal in carrying out our target-of-opportunity observations.
References
- Adelberger, K. L., Steidel, C. C., Shapley, A. E., & Pettini, M. 2003, ApJ, 584, 45 [NASA ADS] [CrossRef] [Google Scholar]
- Amati, L., Guidorzi, C., Frontera, F., et al. 2008, MNRAS, 391, 577 [NASA ADS] [CrossRef] [MathSciNet] [Google Scholar]
- Antonelli, L. A., D’Avanzo, P., Perna, R., et al. 2009, A&A, 507, L45 [NASA ADS] [CrossRef] [EDP Sciences] [Google Scholar]
- Asplund, M., Grevesse, N., Sauval, A. J., & Scott, P. 2009, ARA&A, 47, 481 [NASA ADS] [CrossRef] [Google Scholar]
- Belczynski, K., Holz, D. E., Fryer, C. L., et al. 2010, ApJ, 708, 117 [NASA ADS] [CrossRef] [Google Scholar]
- Berger, E. 2009, ApJ, 690, 231 [NASA ADS] [CrossRef] [Google Scholar]
- Bielby, R., Shanks, T., Weilbacher, P. M., et al. 2010, MNRAS, submitted [arXiv:1005.3028] [Google Scholar]
- Chincarini, G., Moretti, A., Romano, P., et al. 2007, ApJ 671, 1903 [Google Scholar]
- Chincarini, G., Mao, J., Margutti, R., et al. 2010, MNRAS, 406, 2113 [NASA ADS] [CrossRef] [Google Scholar]
- Cummings, J. R., Barthelmy, S. D., Baumgartner, W. H., et al. 2009, GCN Circ., 8886 [Google Scholar]
- Dai, Z. G., & Lu, T. 1998, A&A, 333, L87 [NASA ADS] [Google Scholar]
- D’Avanzo, P., Thöne, C. C., Fugazza, D., et al. 2009a, GCN Circ., 8887 [Google Scholar]
- D’Avanzo, P., Fugazza, D., D’Elia, V., et al. 2009b, GCN Circ., 8895 [Google Scholar]
- Evans, P. A., Goad, M. R., Osborne, J. P., & Beardmore, A. P. 2009, GCN Circ., 8885 [Google Scholar]
- Falcone, A. D., Morris, D., Racusin, J., et al. 2007, ApJ, 671, 1921 [NASA ADS] [CrossRef] [Google Scholar]
- Finkelstein, S. L., Rhoads, J. E., Malhotra, S., Pirzkal, N., & Wang, J. X. 2007, ApJ, 660, 1023 [NASA ADS] [CrossRef] [Google Scholar]
- Fong, W., Berger, E., & Fox, D. B. 2010, ApJ, 708, 9 [NASA ADS] [CrossRef] [Google Scholar]
- Fruchter, A. S., Levan, A. J., Strolger, L., et al. 2006, Nature, 441, 463 [NASA ADS] [CrossRef] [PubMed] [Google Scholar]
- Fugazza, D., Thöne, C. C., D’Elia, V., et al. 2009, GCN Circ., 8892 [Google Scholar]
- Fynbo, J. P. U., Starling, R. L. C., Ledoux, C., et al. 2006, A&A, 451, L47 [NASA ADS] [CrossRef] [EDP Sciences] [Google Scholar]
- Fynbo, J. P. U., Jakobsson, P., Prochaska, J. X., et al. 2009, ApJS, 185, 526 [NASA ADS] [CrossRef] [Google Scholar]
- Gehrels, N., & Perri, M. 2009, GCN Circ., 8890 [Google Scholar]
- Greiner, J., Kruehler, T., Fynbo, J. P. U., et al. 2009, ApJ, 693, 1610 [NASA ADS] [CrossRef] [Google Scholar]
- Ioka, K., Kobayashi, S., & Zhang, B. 2005, ApJ, 631, 429 [NASA ADS] [CrossRef] [Google Scholar]
- Jakobsson, P., Björnsson, G., Fynbo, J. P. U., et al. 2005, MNRAS, 362, 245 [NASA ADS] [CrossRef] [Google Scholar]
- Jakobsson P., Fynbo, J. P. U., Ledoux, C., et al. 2006, A&A, 460, L13 [NASA ADS] [CrossRef] [EDP Sciences] [Google Scholar]
- Kennicutt, R. C. Jr. 1998, ARA&A, 36, 189 [Google Scholar]
- Kouveliotou, C., Meegan, C. A., Fishman, G. J., et al. 1993, ApJ, 413, L101 [NASA ADS] [CrossRef] [Google Scholar]
- Kruehler, T., & Greiner, J. 2009, GCN Circ., 8888 [Google Scholar]
- Leitherer, C., Schaerer, D., Goldader, J. D., et al. 1999, ApJS, 123, 3 [NASA ADS] [CrossRef] [Google Scholar]
- Lv, H., Liang E., Zhang, B. -B., & Zhang, B. 2010, ApJL, submitted [arXiv:1001.0598] [Google Scholar]
- Mannucci, F., Cresci, G., Maiolino, R., et al. 2009, MNRAS, 398, 1915 [NASA ADS] [CrossRef] [Google Scholar]
- Nagamine, K., Zhang, B., & Hernquist, L. 2008, ApJ, 686, L57 [NASA ADS] [CrossRef] [Google Scholar]
- Piranomonte, S., D’Avanzo, P., Covino, S., et al. 2008, A&A, 491, 183 [NASA ADS] [CrossRef] [EDP Sciences] [Google Scholar]
- Perri, M., et al. 2009, GCN Circ., 8884 [Google Scholar]
- Rees, M. J., & Meszaros, P. 1992, MNRAS, 258, 41 [NASA ADS] [CrossRef] [Google Scholar]
- Sakamoto, T., Sato, G., Barbier, L., et al. 2009, ApJ, 693, 922 [NASA ADS] [CrossRef] [Google Scholar]
- Salvaterra, R., & Ferrara, A. 2003, MNRAS, 339, 973 [Google Scholar]
- Salvaterra, R., Cerruti, A., Chincarini, G., et al. 2008, MNRAS, 388, L6 [NASA ADS] [Google Scholar]
- Salvaterra, R., Della Valle, M., Campana, S., et al. 2009, Nature, 461, 1258 [NASA ADS] [CrossRef] [PubMed] [Google Scholar]
- Savaglio, S., Glazebrook, K., & LeBorgne, D. 2009, ApJ, 691, 182 [NASA ADS] [CrossRef] [MathSciNet] [Google Scholar]
- Schlegel, D. J., Finkbeiner, D. P., & Davis, M. 1998, ApJS, 500, 525 [NASA ADS] [CrossRef] [Google Scholar]
- Shapley A. E., Steidel, C. C., Pettini, M., & Adelberger, K. L. 2003, ApJ, 588, 65 [NASA ADS] [CrossRef] [Google Scholar]
- Shioya, Y., Taniguchi, Y., Sasaki, S. S., et al. 2009, ApJ, 696, 546 [NASA ADS] [CrossRef] [Google Scholar]
- Tanvir, N., Fox, D. B., Levan, A. J., et al. 2009, Nature, 461, 1254 [NASA ADS] [CrossRef] [PubMed] [Google Scholar]
- Thöne, C. C., Fugazza, D., D’Avanzo, P., et al. 2009, GCN Circ., 8889 [Google Scholar]
- Ukwatta, T. N., Stamatikos, M., Dhuga, K. S., et al. 2010, ApJ, 711, 1073 [NASA ADS] [CrossRef] [Google Scholar]
- Vazquez, G. A., & Leitherer, C. 2005, ApJ, 621, 695 [NASA ADS] [CrossRef] [Google Scholar]
- Wang,, Malhotra, S., Rhoads, J. E., Zhang H.-T., & Finkelstein S. L. 2009, ApJ, 706, 762 [NASA ADS] [CrossRef] [Google Scholar]
- Zhang, B., Fan, Y. Z., Dyks, J., et al. 2006, ApJ, 642, 354 [NASA ADS] [CrossRef] [Google Scholar]
- Zhang, B., Zhang, B.-B., Virgili, F. J., et al. 2009, ApJ, 703, 1696 [NASA ADS] [CrossRef] [Google Scholar]
All Tables
Measured wavelengths, derived redshift, and equivalent widths (EWs) of detected absorption lines
All Figures
|
Fig. 1 Four channels and combined BAT mask-weighted light curve of GRB 090205. Bin size is 1024 ms. |
| In the text | |
|
Fig. 2 X-ray light curve in count rate. The solid line shows the best-fit power law obtained excluding the flaring activity (marked by open circles) present at ~T0 + 6 ks and ~T0 + 20 ks, respectively. The conversion factor is 1 cts s-1 = 3.6 × 10⁻¹¹ erg cm-2 s-1. Errors are at 68% c.l. |
| In the text | |
|
Fig. 3 Optical R- (dots) and I-band (squares) afterglow light curve. The solid line shows the best-fit power law. Magnitude are in AB system and are not corrected for Galactic extinction. Errors are at 68% c.l. |
| In the text | |
|
Fig. 4 VLT/FORS1 spectrum of the GRB 090205 afterglow at z = 4.6503 ± 0.0025. |
| In the text | |
|
Fig. 5 Detailed analysis of the Ly-α emission line detection. The top panel shows the blow up of the region centered on the Ly-α emission at 6873.45 Å (dashed line), corresponding to 1215.67 Å in the emitter rest frame. The central panel shows the corresponding signal-to-noise ratio. The bottom panel reports the counts from the sky (blue line) and for the sky+object (red line). The position of the Ly-α emission in the 2D spectrum (shown in both panels), is marked by a circle and has an offset with respect to the afterglow continuum (corresponding to 0.3′′; see Sect. 2.2.3 for details). |
| In the text | |
|
Fig. 6 Top panel: available data and expected magnitude of the GRB 090205 host for different galaxy types. The SEDs are normalized to reproduce the I band measure. Open circles (filled triangles) represent the data (upper limits), whereas the horizontal lines show the expected AB apparent magnitude of the object in the VRIJHK bands for different host galaxy types: magenta is for elliptical, red for Sab, yellow for Scd, green for irregular, cyan and blue for starburst galaxies. Vertical lines mark the position of the Lyman limit, and Lyβ and Ly-α lines (from left to right), respectively. Bottom panels: expected (I − J), (I − H), and (I − K) colors of the different galaxy types. Observational limit on the colors are plotted with triangles. |
| In the text | |
|
Fig. 7 Observations of the host galaxy of GRB 090205 shown with data points and upper limits are compared with synthetic SEDs for a starburst galaxy with different stellar ages τ. From top to bottom, lines corresponds to τ = 500, 100, 50, 10 Myr, respectively. We assume a Salpeter IMF between 0.1–100 M⊙, Z = 0.4Z⊙ and no dust extinction in the host galaxy. The SED are normalized to reproduce the observation in the I band. |
| In the text | |
Current usage metrics show cumulative count of Article Views (full-text article views including HTML views, PDF and ePub downloads, according to the available data) and Abstracts Views on Vision4Press platform.
Data correspond to usage on the plateform after 2015. The current usage metrics is available 48-96 hours after online publication and is updated daily on week days.
Initial download of the metrics may take a while.