| Issue |
A&A
Volume 522, November 2010
|
|
|---|---|---|
| Article Number | A107 | |
| Number of page(s) | 7 | |
| Section | Stellar structure and evolution | |
| DOI | https://doi.org/10.1051/0004-6361/201014788 | |
| Published online | 09 November 2010 | |
The optical counterpart to IGR J06074+2205: a Be/X-ray binary showing disc loss and V/R variability
1
IESL, Foundation for Reseach and Technology-Hellas,
71110
Heraklion,
Greece
e-mail: This email address is being protected from spambots. You need JavaScript enabled to view it.
2
Physics Department, University of Crete,
71003
Heraklion,
Greece
e-mail: This email address is being protected from spambots. You need JavaScript enabled to view it.
3
Harvard-Smithsonian Center for Astrophysics, 60 Garden Street,
Cambridge,
MA
02138,
USA
Received: 14 April 2010
Accepted: 24 June 2010
Abstract
Context. Current X-ray missions are regularly discovering new X/γ-ray sources, so identifying the counterparts of these high-energy sources at other wavelengths is important for determining their nature. In particular, optical observations are crucial in the study of X-ray binary populations in our Galaxy.
Aims. The main goal of this work is to determine the properties of the optical counterpart to the INTEGRAL source IGR J06074+2205 and study its long-term optical variability. Although its nature as a high-mass X-ray binary has been suggested, little is known about its physical parameters.
Methods. We have been monitoring IGR J06074+2205 since 2006 in the optical band. We present optical photometric BVRI and spectroscopic observations covering the wavelength band 4000 − 7000 Å. The blue spectra allow us to determine the spectral type and luminosity class of the optical companion and the red spectra, together with the photometric magnitudes, were used to derive the colour excess E(B − V) and estimate the distance.
Results. We have carried out the first detailed optical study of the massive component in the high-mass X-ray binary IGR J06074+2205. We find that the optical counterpart to IGR J06074+2205 is a V = 12.3 B0.5Ve star located at a distance of ~4.5 kpc. Monitoring of the Hα line reveals V / R variability and an overall decline in its equivalent width. The Hα line has been seen to revert from an emission to an absorption profile. We attribute this variability to global changes in the structure of the Be star’s circumstellar disc that eventually led to the complete loss of the disc. The density perturbation that gives rise to the V / R variability vanishes when the disc becomes too small.
Key words: supernovae: individual: IGR J06074+2205 / stars: emission-line, Be / stars: neutron / X-rays: binaries
© ESO, 2010
1. Introduction
Photometric measurements of the optical counterpart to IGR J06074+2205.
Log of the spectroscopic observations.
IGRJ06074+2205 was discovered by INTEGRAL/JEM-X during public observations of the Crab region that took place on 15 and 16 February 2003 (Chevenez et al. 2004). The source was detected with a flux of ~ 7 mCrab ( ± 2 mCrab) in the energy range 3 − 10 keV and 15 mCrab in the range 10 − 20 keV range on 15 February 2003. A day later the flux had decreased to less than 5 mCrab.
Optical spectroscopic observations performed with the MDM 2.4 m telescope of the brightest stars in the field around the INTEGRAL position on 27 December 2005 found a Be star within 1′ of the INTEGRAL position, exhibiting Hα in emission with an equivalent width (EW(Hα)) of –6.6 Å (Halpern & Tyagi 2005). Its optical and infrared brightness obtained from the USNO A2.0 and 2MASS catalogues is B = 13.3, R = 12.1, J = 10.49, H = 10.19, and K = 9.96 mag.
On 2 December 2006 a 5-ks Chandra observation improved the accuracy of the X-ray position and allowed confirmation of the Be star suggested by Halpern & Tyagi (2005) as the correct optical counterpart (Tomsick et al. 2006). The Chandra observation also served to discard the radio source NVSS J060718+220452, which lies 80′′ from the reported position of the X-ray source (Pooley 2004; Pandey et al. 2006), as a possible radio counterpart to IGR J06074+2205. Chandra detected only one source in the INTEGRAL error circle at a position of RA = 06h07m26s.62, Dec = 22d05m47s.6 (J2000). The flux was 2 × 10-12 erg cm-2 s-1 in the energy range 0.3 − 10 keV. The energy spectrum could be fitted with an absorbed power law with NH = (6 ± 2) × 1022 cm-2 and a photon index of 1.3 ± 0.8 (90% confidence errors). The absorbed flux value was nearly 60 times lower than the value of its discovery, which is consistent with the behaviour of Be X-ray binaries.
From low-resolution spectroscopic observations obtained using the G. D. Cassini 1.5 m telescope in Loiano observatory, Masetti et al. (2006) suggests a B8III optical counterpart to IGR J06074+2205. However, their spectra do not have the spectral resolution to allow a precise classification. In fact, no Galactic Be/X-ray binary contains a Be star with spectral type later than B2, which casts some doubt on the accuracy of this classification.
Nevertheless, the available data seem to indicate that IGR J06074+2205 is a Be/X-ray binary. They are a class of high-mass X-ray binaries that consist of a Be star and a neutron star (Ziolkowski 2002). The mass donor in these systems is a relatively massive ( ≳ 10 M⊙) and fast-rotating ( ~ 80% of break-up velocity) star, whose equator is surrounded by a disc formed from photospheric plasma ejected by the star. Hα in emission is typically the dominant feature in the spectra of such stars. In fact, the strength of the Balmer lines in general and of Hα in particular (whether it has ever been in emission), and a luminosity class III-V, constitute the defining properties of this class of objects. Be stars are also observed as single objects, i.e. not forming part of a binary system (Porter & Rivinius 2003). The equatorial discs are believed to be quasi-Keplerian and supported by viscosity (Okazaki 2001). The shape and strength of the spectral emission lines are useful indicators of the state of the disc. Global disc variations include the transition from a Be phase, i.e., when the disc is present, to a normal B star phase, i.e., when the disc is absent and cyclic V / R changes, i.e., long-term cyclic changes in the ratio of the blue to red peaks of a split profile that are attributed to the precession of a density perturbation inside the disc (Okazaki 1991).
In this work we present the first detailed study of the optical counterpart to the X-ray source IGR J06074+2205. Our photometric observations are the first dedicated observations of the source. So far, the reported magnitudes come from various catalogues. In most cases it is not possible to know the exact date of those observations, hence it is not possible to perform variability studies. In addition, our monitoring of the Hα line allows us to investigate the long-term variability of the circumstellar disc. We confirm that IGR J06074+2205 is a Be/X-ray binary. However, its optical companion is more massive than suggested by Masetti et al. (2006). The main body of the paper corresponds to Sects. 3 and 4. In Sect. 3 we present the results of our spectroscopic observations, with emphasis on the variability of the Hα line, while in Sect. 4 we discuss the implications of the results. Sect. 2 describes the observations and in Sect. 5 we present our conclusions.
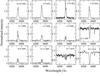 |
Fig. 1 Evolution of the Hα line profile. V/R variability as well as a long-term decrease in the line strength is seen. |
2. Observations
Optical spectroscopic and photometric observations of the optical counterpart to the INTEGRAL source IGR J06074+2205 were obtained from the 1.3 m telescope of the Skinakas observatory in Crete (Greece) and from the Fred Lawrence Whipple Observatory at Mt. Hopkins (Arizona). In addition, IGR J06074+2205 was observed in service time with the Nordic Optical telescope (NOT) and the EEV42-40, 2K × 2K chip on the night of 25 December 2007 (Grism#16) and on the night 28 March 2010 (Grism#8). The 1.3 m telescope of the Skinakas Observatory (SKI) was equipped with a 2000 × 800 ISA SITe CCD and a 1302 l mm-1 grating, giving a nominal dispersion of ~ 1 Å/pixel. We also observed IGR J06074+2205 in queue mode with the 1.5-m telescope (FLW) at Mt. Hopkins (Arizona) and the FAST-II spectrograph plus FAST3 CCD, a backside-illuminated 2688 × 512 UA STA520A chip with 15 μm pixels. The observation on 12 September 2007 was obtained with the 1200 l/mm grating and the rest with the 600 l/mm grating. Spectra of comparison lamps were taken before each exposure in order to account for small variations in the wavelength calibration during the night. To ensure a homogeneous processing of the spectra, all of them were normalised with respect to the local continuum, which was rectified to unity by employing a spline fit.
The photometric observations were made from the 1.3-m telescope of the Skinakas Observatory. IGR J06074+2205 was observed through the Johnson B, V, R, and I filters. For the photometric observations, the telescope was equipped with a 2048 × 2048 ANDOR CCD with a 13.5 μm pixel size. Standard stars from the Landolt list (Landolt 2009) were used for the transformation equations. Reduction of the data was carried out in the standard way using the IRAF tools for aperture photometry.
The photometric magnitudes are given in Table 1, while the log of the spectroscopic observations is shown in Table 2.
3. Results
3.1. The Hα line: evolution of spectral parameters
Our monitoring of IGR J06074+2205 reveals that the Hα line is highly variable, both in strength and shape. The line always shows a double-peaked profile but the relative intensity of the blue (V) over the red (R) peaks varies. Table 2 gives the log of the spectroscopic observations and some important parameters that resulted from fitting two Gaussians to the Hα line profile. Column 6 gives EW(Hα). The main source of uncertainty in EW(Hα) stems from the always difficult definition of the continuum. The EW(Hα) given in Table 2 corresponds to the average of twelve measurements, each one from a different definition of the continuum and the error is the scatter (standard deviation) present in those twelve measurements.
Column 7 gives the peak separation, Δpeak, of the blue and red peaks. The peak separation is simply the difference between the central wavelength of the red minus the blue peak in velocity units (Δλ/λ × c), where c is the speed of light. The errors are estimated by propagating the uncertainty in the determination of the central wavelength of the Gaussian profile used to fit the Hα profile. The uncertainty of the best-fit peak wavelengths are at 68% confidence intervals. The peak separation is related to the size of the Be star’s disc since 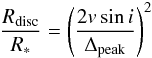 (1)where vsini is the projected rotational velocity of the B star (v the equatorial rotational velocity and i the inclination of the equatorial plane with respect to the observer).
Column 8 shows the ratio between the core intensity of the blue and red humps. The V / R ratio is computed as the logarithm of the ratio of the relative fluxes at the blue and red emission peak maxima (without prior correction for the underlying continuum level). Thus negative values indicate a red-dominated peak, that is, V < R.
Figure 1 displays the evolution of the line profiles. V / R variability is clearly seen, indicating significant changes in the structure of the equatorial disc on timescales of months. In addition, a long-term weakening of the disc is suggested by the decrease in EW(Hα) (Fig. 2), which changed from ~ − 12 Å in September 2007 to ~ − 3 Å a year later. Negative values of EW(Hα) mean that the line displays an emission profile. In March 2010, EW(Hα) was positive, indicating an absorption profile.
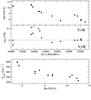 |
Fig. 2 Evolution of EW(Hα) (top) and V / R ratio (middle) with time. The bottom panel shows the peak separation as a function of EW(Hα). |
3.2. Spectral classification
The blue spectrum of IGR J06074+2205 (Fig. 3, middle) is dominated by hydrogen and neutral helium absorption lines, clearly indicating an early-type star (O or B). The Balmer series lines from Hβ up to Hη at 3835 Å are seen in absorption. None or very weak He II lines (λ4541, λ4686) are present, which implies a type later than B0. The weak Mg II λ4481 indicates a type earlier than B2. The strong C III + O II blend allows us to constrain the upper limit better because its presence indicates a type earlier than B1.5. The primary classification criteria in the spectral range O9-B1.5, namely the ratio of Si IV at λ4686 to Si III at λ4552-68-75, cannot be used because the fast rotation blurs the weak Si IV line. Nevertheless, Si III 4552-68-75 is clearly present, which would imply a spectral type earlier than B2, if the star is on the main sequence; Si III has its maximum strength at type B0.5V and is no longer seen at B2V (Walborn & Fitzpatrick 1990).
As for the luminosity class, the relative strength of the Si IIIλ4552-68-75 complex and the CIII + OII blends compared to that of nearby He I lines favours a main sequence classification. Likewise, the low relative intensity of OII lines also indicates a luminosity class V star.
A visual comparison of the IGR J06074+2205 spectrum to those of the standards shown in Walborn & Fitzpatrick (1990) reveals that the spectrum of HD 36960 is the most similar one. Therefore, we assign a spectral type B0.5V to IGR J06074+2205. However, a slightly later type of B1V cannot be ruled out. Figure 3 also shows the spectra of two MK standard stars, namely, ϵ Per (a B0V star) and 42 Ori (a B1V star).
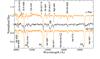 |
Fig. 3 Identification of the He and metallic lines used for spectral classification in IGR J06074+2205 (middle spectrum). A comparison with two MK standards is provided: the B0V ϵ Per (top) and the B1V 42 Ori (bottom). |
3.3. Reddening and distance
To estimate the distance, the amount of interstellar extinction AV = R × E(B − V) to the source has to be determined. The observed colour of IGR J06074+2205 is (B − V) = 0.58 ± 0.03, while the expected one for a B0.5V star (B − V)0 = − 0.26 (Johnson 1966; Gutiérrez-Moreno 1979; Wegner 1994). Thus we derive a colour excess of E(B − V) = 0.84 ± 0.03. After assuming the standard extinction law R = 3.1 and an average absolute magnitude for a B0.5V star of MV = − 3.5 ± 0.5 (Vacca et al. 1996; Wegner 2006), the distance to IGR J06074+2205 is estimated as 4.4 ± 1.0 kpc. Since the photometric magnitudes were obtained when the source was displaying a relatively high value of the EW(Hα), this estimate of the distance should be taken as a lower limit. In the absence of the disc, the colour B − V is expected to be less (more “blue”), which would imply a lower value of E(B − V), hence longer distance.
The colour excess can also be estimated from the strength of the diffuse interstellar bands (Herbig 1975; Herbig & Leka 1991; Galazutdinov et al. 2000). Using the strongest lines (6203 Å, 6269 Å, 6276 − 79 Å, and 6613 Å) in the red spectrum of IGR J06074+2205, the estimated colour excess is E(B − V) = 0.85 ± 0.12, in excellent agreement with the photometric derived value, hence supporting the spectral classification suggested. The error is the standard deviation of the measurements of all employed lines.
3.4. Rotational velocity
Be stars are fast rotators. They have, on average, higher observed rotational velocities than B stars as a group (Slettebak 1982). Determining the rotational velocity is important because it is believed to be a crucial parameter in the formation of the circumstellar disc. A rotational velocity close to the break-up or critical velocity (i.e. the velocity at which centrifugal forces balance Newtonian gravity) reduces the effective equatorial gravity to the extent that weak processes, such as gas pressure and/or non-radial pulsations, may trigger the ejection of photospheric matter with sufficient energy and angular momentum to make it spin up into a Keplerian disc. At present there is no consensus on how close to their critical velocity Be stars rotate, although observations suggest that a large fraction of Be stars rotate at 70 − 80% of the critical value (Slettebak 1982; Porter 1996; Yudin 2001).
The projected rotational velocity can be estimated by measuring the full width at half maximum (FWHM) of HeI lines (Steele et al. 1999). The projected rotational velocity was obtained as the average of the values from three HeI lines at 4026 Å, 4143 Å, and 4471 Å. We measured the width of these lines from the NOT spectrum because it provides the highest resolution in our sample. We made three different selections of the continuum and fitted Gaussian profiles to these lines. We obtained vsini = 260 ± 20 km s-1. The value quoted is the weighted average of the nine measurements.
Table 3 gives the rotational velocity of some Be/X-ray binaries obtained from the reference in Col. 8. Column 6 gives the inclination angle of the orbit with respect to the line of sight, which allows estimating the true rotation velocity of the Be star. The critical velocity depends on the spectral type. For Be/X-ray binaries whose spectral type distribution spans a very narrow range (O9-B2), the critical or break-up velocity is 500 − 600 km s-1, with the lower end corresponding to later spectral types (Cranmer 2005). The term shell refers to double-peak lines whose central depression is lower than the stellar continuum (see e.g. Hummel & Vrancken 2000). This type of profile occurs in systems with high inclination angles, i.e., the so-called edge-on systems.
Comparison of IGR J06074+2205 with other Be/X-ray binaries.
4. Discussion
All spectroscopically identified optical companions of Be/X-ray binaries in the Milky Way have spectral types earlier than B3. To the authors’ knowledge there is no one single exception. In terms of the mass, this means that there are no Be stars in Be/X binaries with masses lower than 8 M⊙. Thus the classification of IGR J06074+2205 as a B8III reported by Masetti et al. (2006) was surprising.
This narrow range of spectral types in Be stars that are part of binary systems contrasts with the wide range found in isolated systems (Negueruela 1998). The “Be phenomenon” can be observed from late O stars to early A stars. Such a narrow range in masses for Be/X-ray binaries can be explained by invoking a non-conservative binary evolution. Portegies Zwart (1995) have shown that, if during the evolution of the binary the amount of angular momentum lost per unit mass through the second Lagrangian point increases, then the number of late-type Be stars with a neutron star companion decreases. The reason for this is that a significant loss of angular momentum implies that more binaries end up as mergers. On similar grounds, van Bever & Vanbeveren (1997) compared two models that only differed in the amount of angular momentum lost during non-conservative Roche Lobe overflow and found that the minumum mass of the mass-gainer star corresponding to the model with the higher loss of angular momentum was ~7 M⊙. The spectral type that we determine for the optical counterpart of IGR J06074+2205, namely B0.5V is in good agreement with the spectral type distribution of galactic Be/X-ray binaries.
The Hα line shows V/R variability, that is, the cyclic variation in the relative intensity of the blue (V) and red (R) peaks in the split profile of the line. The V/R variability is believed to be caused by the gradual change in the amount of the emitting gas approaching and receding from the observer due to the precession of a density perturbation in the disc. Double-peak symmetric profiles are expected when the high-density part is behind or in front of the star, while asymmetric profiles are seen when the high-density perturbation is on one side of the disc. More precisely, when the high-density part of the disc is moving toward the observer, we expect to see a blue-dominated V > R profile, while when the high-density part is receding from the observer, red-dominated profiles V < R are expected (Telting et al. 1994). For systems with high-inclination angles, the two symmetric cases can be readily distinguished since the central depression between the two symmetric peaks is much more pronounced (reaching or going beyond the continuum), when the perturbation is between the observer and the star (the so-called shell profile). If the density perturbation revolves around the star in the same direction as the material in the disc (prograde precession), then the V / R sequence would be, according to Telting et al. (1994)V = R (perturbation behind the star) − → V > R − → V = R (perturbation in front of the star, shell profile) − → V < R.
Figure 1 shows the Hα line profile from most of the spectra that we obtained. The first recorded spectrum displays a red-dominated peak, V < R. The relative intensity of the two peaks appeared reversed, i.e. V > R, about a year later. If we interpreted the January 2009 line as an emission line affected by a strong shell component (self-absorption from the disc), then the V > R would be followed by a shell phase and we would conclude that the motion is prograde.
The available data do not allow us to constrain the duration of the V / R cycle because a major structural change occurred that brought the V / R cycle to an end. This major event was the loss of the equatorial disc. Nevertheless, we can constrain the quasiperiod of the V / R cycle from the two complete phases covered by the data, namely, the V > R and shell phases. The shell phase would have lasted for about 14 − 16 months (July − August 2008 to November − December 2009). Due to the observational gaps, the V > R phase is less constrained. The maximum duration for this phase is approximately 20 months (December 2006 to August 2008). Since we do not expect the transition between phases to be abrupt, it is reasonable to limit the V > R phase to 15 − 17 months (February 2007 to June 2008). Assuming then that each V/R phase lasts for about 15 months, the V/R quasiperiod is estimated to be ~5 years.
The long-term decline of EW(Hα), shown in Fig. 2, undoubtedly implies a progressive weakening of the disc over a period of ~3 years. Moreover, the latest spectrum in March 2010 displays an absorption profile. The reversion from emission to absorption is generally believed to stem from the disappearance of the disc. Nevertheless that the line still shows some residual emission at the wings and that, although positive, the EW(Hα), +2.2, is still somehow smaller than expected for a non-emitting B0.5V star (which according to Jaschek & Jaschek 1987 should range between +3.5 and +4 Å), may imply that the disc-loss phase continues at the time of writing.
Regardless of whether the disc vanished completely or not, the data show one important result, namely, the V / R variability is absent in small discs. In other words, only in well-developed discs can the density perturbation survive. We have searched the literature for spectral line variability immediately before and after disc-loss episodes in other Be/X-ray binaries (see Col. 4 in Table 3). We observe that shortly before the disappearance of the disc and during the first instances of the formation of a new disc, the Hα line profile is symmetric and double peaked. None of the Be/X-ray binaries that have gone through disc-loss phases and for which there is a good optical follow-up coverage exhibited asymmetric profiles during the initial stages of disc formation: X Per in 1990 (Clark et al. 2001), 4U 0115+63 in 1997 (Negueruela et al. 2001) and in 2002 (Reig et al. 2007), 1A 0535+262 in 1999 (Haigh et al. 1999; Grundstrom et al. 2007) and RX J0440.9+4431 in 2001 (Reig et al. 2004). That is, the effects of the density perturbation do not show up until the disc is fully developed. The same result holds for the final stages of disc loss. Just before the detection of the absorption profile, the V / R ratio is ~1.
Using the equation given in Sect. 3.1, the rotational velocities given in Table 3 and the peak separation of the first available asymmetric profile after the disc loss, namely, Δpeak = 220 km s-1 (X-Per, Clark et al. 2001), Δpeak = 305 km s-1 (4U 0115+63, Negueruela et al. 2001), we find that the disc must reach a radius of ~4 R∗ for the onset of the V / R variability. Virtually the same value is derived from Fig. 5 in Grundstrom et al. (2007) for 1A 0535+262. Only a lower limit, > 2 R∗, can be given for RX J0440.9+4431 (Reig et al. 2004).
The data before the disc-loss phase is even scarcer. Nevertheless, the available data seems to indicate that, before the disc loss, the density wave may survive in smaller discs (~ 1.5 − 2 R∗). In 4U 0115+63, the last available spectrum prior to the disc-loss event showing substantial V / R variability corresponds to a disc radius of 1.6 R∗. In IGR J06074+2205, the peak separation measured in the spectrum taken on 1 January 2008 corresponds to a radius of 2.6 R∗.
The peak separation does not necessarily indicate the geometrical size of the disc, but rather the radial distance at which Hα emission becomes optically thick. How well this correlates with the disc size depends on its density distribution. It is generally assumed that the density falls off as a power law with increasing distance from the star,  . That the power-law index n estimated observationally lies in a very narrow range 3 < n < 3.5 (Waters et al. 1988; Jones et al. 2008) and that the relevant radius in this order of magnitude calculation is that of the Hα emitting region together justify the validity of the comparison.
Given the large observational gaps in the present observations it is clear that further long-term spectroscopic monitoring of these and other systems are required to confirm these results and set better constraints on the variability timescales and behaviour of the disc perturbations.
5. Conclusion
We performed optical photometric and spectroscopic observations of the optical counterpart to IGR J06074+2205. From the photometric magnitudes and colours and the strength of various diffuse interstellar bands we estimated the distance to be ~4.5 kpc. From the ratios of various metallic lines we derived a spectral type B0.5V and estimated the rotation velocity of the underlying B star in 260 km s-1 from the width of three He I lines.
The long-term optical variability of this system is characterised by global changes in the structure of the equatorial disc around the Be star companion. These global changes manifest as asymmetric profiles of the Hα line and a significant decay of its intensity. The asymmetry consists of V / R variability with characteristic timescales of a few months. The Hα line has been seen to change from emission to absorption, indicating the loss of the equatorial disc. The V / R cycle stopped when the equatorial disc became too small because a small disc cannot support a density perturbation. During the final stages of the disc evolution, V / R asymmetries can be seen up to a disc radius of ~2 R∗. The density wave fades away before the complete dissipation of the disc because the disc became too tenuous to support the density perturbation. A comparison with other systems reveals that, after the loss of the disc, a density perturbation does not develop until the disc radius is of the order of 4 R∗.
Acknowledgments
We thank the observers P. Berlind and M. Calkins for performing the FLWO observations. This work has been supported in part by the European Union Marie Curie grant MTKD-CT-2006-039965 and EU FP7 “Capacities” GA No206469. This work has made use of NASA’s Astrophysics Data System Bibliographic Services and of the SIMBAD database, operated at the CDS, Strasbourg, France. Skinakas Observatory is a collaborative project of the University of Crete, the Foundation for Research and Technology-Hellas, and the Max-Planck-Institut für Extraterrestrische Physik.
References
- Chenevez, J., Budtz-Jorgensen, C., Lund, N., et al. 2004, ATel #223 [Google Scholar]
- Clark, J. S., Tarasov, A. E., Okazaki, A. T., Roche, P., & Lyuty, V. M. 2001, A&A, 380, 615 [NASA ADS] [CrossRef] [EDP Sciences] [Google Scholar]
- Cranmer, S. R. 2005, ApJ, 634, 585 [NASA ADS] [CrossRef] [Google Scholar]
- Delgado-Martí, H., Levine, A. M., Pfahl, E., & Rappaport, S. A. 2001, ApJ, 546, 455 [NASA ADS] [CrossRef] [Google Scholar]
- Galazutdinov, G. A., Musaev, F. A., Krelowski, J., & Walker, G. A. H. 2000, PASP, 112, 648 [NASA ADS] [CrossRef] [Google Scholar]
- Grundstrom, E. D., Boyajian, T. S., Finch, C., et al. 2007, ApJ, 660, 1398 [NASA ADS] [CrossRef] [Google Scholar]
- Gutiérrez-Moreno, A. 1979, PASP, 91, 299 [NASA ADS] [CrossRef] [Google Scholar]
- Haigh, N. J., Coe, M. J., Steele, I., & Fabregat, J. 1999, MNRAS, 310, L21 [NASA ADS] [CrossRef] [Google Scholar]
- Haigh, N. J., Coe, M. J., & Fabregat, J. 2004, MNRAS, 350, 1457 [NASA ADS] [CrossRef] [Google Scholar]
- Halpern, J. P., & Tyagi, S. 2005, ATel #682 [Google Scholar]
- Herbig, G. H. 1975, ApJ, 196, 129 [NASA ADS] [CrossRef] [Google Scholar]
- Herbig, G. H., & Leka, K. D. 1991, ApJ, 382, 193 [NASA ADS] [CrossRef] [Google Scholar]
- Hummel, W., & Vrancken, M. 2000, A&A, 359, 1075 [NASA ADS] [Google Scholar]
- Janot-Pacheco, E., Ilovaisky, S. A., & Chevalier, C. 1981, A&A, 99, 274 [NASA ADS] [Google Scholar]
- Janot-Pacheco, E., Chevalier, C., & Ilovaisky, S. A. 1982, IAUS, 98, 151 [Google Scholar]
- Jaschek, C., & Jaschek, M. 1987, in The classification of stars (Cambridge University Press), 137 [Google Scholar]
- Johnson, H. 1966, ARA&A, 4, 193 [NASA ADS] [CrossRef] [Google Scholar]
- Jones, C. E., Sigut, T. A. A., & Porter, J. M. 2008, MNRAS, 386, 1922 [NASA ADS] [CrossRef] [Google Scholar]
- Landolt, A. U. 2009, AJ, 137, 4186 [NASA ADS] [CrossRef] [Google Scholar]
- Lyubimkov, L. S., Rostopchin, S. I., Roche, P., & Tarasov, A. E. 1997, MNRAS, 286, 549 [NASA ADS] [CrossRef] [Google Scholar]
- Masetti, N., Bassani, L., Bazzano, A., et al. 2006, A&A, 455, 11 [NASA ADS] [CrossRef] [EDP Sciences] [Google Scholar]
- Negueruela, I. 1998, A&A, 338, 505 [NASA ADS] [Google Scholar]
- Negueruela, I., Roche, P., Fabregat, J., & Coe, M. J. 1999, MNRAS, 307, 695 [NASA ADS] [CrossRef] [Google Scholar]
- Negueruela, I., Okazaki, A. T., Fabregat, J., et al. 2001, A&A, 369, 117 [NASA ADS] [CrossRef] [EDP Sciences] [Google Scholar]
- Okazaki, A. T. 1991, PASJ, 43, 75 [NASA ADS] [Google Scholar]
- Okazaki, A. T. 2001, PASJ, 53, 119 [NASA ADS] [CrossRef] [Google Scholar]
- Pandey, M., Manchanda, R. K., Rao, A. P., Durouchoux, P., & Ishwara-Chandra 2006, A&A, 446, 471 [NASA ADS] [CrossRef] [EDP Sciences] [Google Scholar]
- Parkes, G. E., Murdin, P. G., & Mason, K. O. 1980, MNRAS, 190, 537 [NASA ADS] [CrossRef] [Google Scholar]
- Pooley, G. 2004, ATel #226 [Google Scholar]
- Portegies Zwart, S. F. 1995, A&A, 296, 691 [NASA ADS] [Google Scholar]
- Porter, J. M. 1996, MNRAS, 280, L31 [NASA ADS] [CrossRef] [Google Scholar]
- Porter, J. M., & Rivinius, T. 2003, PASP, 115, 1153 [NASA ADS] [CrossRef] [Google Scholar]
- Reig, P., Fabregat, J., & Coe, M. J. 1997, A&A, 322, 193 [NASA ADS] [Google Scholar]
- Reig, P., Negueruela, I., Buckley, D. A. H., et al. 2001, A&A, 367, 266 [NASA ADS] [CrossRef] [EDP Sciences] [Google Scholar]
- Reig, P., Negueruela, I., Fabregat, J., et al. 2004, A&A, 421, 673 [NASA ADS] [CrossRef] [EDP Sciences] [Google Scholar]
- Reig, P., Negueruela, I., Fabregat, J., Chato, R., & Coe, M. J. 2005, A&A, 440, 1079 [NASA ADS] [CrossRef] [EDP Sciences] [Google Scholar]
- Reig, P., Larionov, V., Negueruela, I., Arkharov, A. A., & Kudryavtseva, N. A. 2007, A&A, 462, 1081 [NASA ADS] [CrossRef] [EDP Sciences] [Google Scholar]
- Slettebak, A. 1982, ApJS, 50, 55 [NASA ADS] [CrossRef] [Google Scholar]
- Steele, I. A., Negueruela, I., & Clark, J. S. 1999, A&ASS, 137, 147 [NASA ADS] [CrossRef] [EDP Sciences] [Google Scholar]
- Telting, J. H., Heemskerk, M. H. M., Henrichs, H. F., & Savonije, G. J. 1994, A&A, 288, 558 [NASA ADS] [Google Scholar]
- Tomsick, J. A., Chaty, S., Rodriguez, J., Walter, R., & Kaaret, P. 2006, ATel, 959 [Google Scholar]
- Vacca, W. D., Garmany, C. D., & Shull, J. M. 1996, ApJ, 460, 914 [NASA ADS] [CrossRef] [Google Scholar]
- van Bever, J., & Vanbeveren, D. 1998, A&A, 322, 116 [Google Scholar]
- Walborn, N. R., & Fitzpatrick, E. L. 1990, PASP, 102, 379 [NASA ADS] [CrossRef] [Google Scholar]
- Waters, L. B. F. M., van den Heuvel, E. P. J., Taylor, A. R., Habets, G. M. H. J., & Persi, P. 1988, A&A, 198, 200 [NASA ADS] [Google Scholar]
- Webster, B. L. 1974, MNRAS, 169, 53 [NASA ADS] [Google Scholar]
- Wegner, W. 1994, MNRAS, 270, 229 [NASA ADS] [CrossRef] [Google Scholar]
- Wegner, W. 2006, MNRAS, 371, 185 [NASA ADS] [CrossRef] [Google Scholar]
- Yudin, R. V. 2001, A&A, 368, 912 [NASA ADS] [CrossRef] [EDP Sciences] [Google Scholar]
- Ziolkowski, J. 2002, MmSAI, 73, 1038 [Google Scholar]
All Tables
All Figures
|
Fig. 1 Evolution of the Hα line profile. V/R variability as well as a long-term decrease in the line strength is seen. |
| In the text | |
|
Fig. 2 Evolution of EW(Hα) (top) and V / R ratio (middle) with time. The bottom panel shows the peak separation as a function of EW(Hα). |
| In the text | |
|
Fig. 3 Identification of the He and metallic lines used for spectral classification in IGR J06074+2205 (middle spectrum). A comparison with two MK standards is provided: the B0V ϵ Per (top) and the B1V 42 Ori (bottom). |
| In the text | |
Current usage metrics show cumulative count of Article Views (full-text article views including HTML views, PDF and ePub downloads, according to the available data) and Abstracts Views on Vision4Press platform.
Data correspond to usage on the plateform after 2015. The current usage metrics is available 48-96 hours after online publication and is updated daily on week days.
Initial download of the metrics may take a while.