Fig. 8
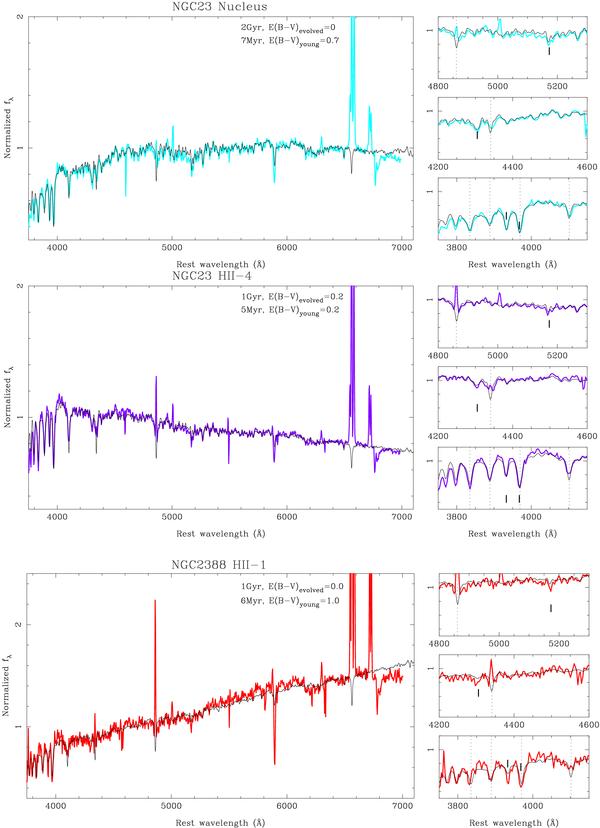
a) Examples of fits to the stellar continuum of regions in our sample of galaxies. The bluest rest-frame wavelength used for the modeling is 3800 Å. For each region, the left panel shows the observed spectrum (thick color line) and the model spectrum (thin black line) in arbitrary units. The spectra are normalized to unity at a wavelength within the normalizing bin (4400−4800 Å). The model parameters for each region are given at the top right of each plot. The right panels are blow-ups of some spectral regions of interest. We mark the high order Balmer lines as well as Hδ, Hγ, and, Hβ as dotted lines. The Ca ii H and Ca ii K lines (lower right panel), the G-band (middle right panel), and the Mg ib band (upper right panel) are marked as thick solid lines. The spectral resolution of the BC03 models has been slightly degraded to match approximately that of our PMAS spectra.
Current usage metrics show cumulative count of Article Views (full-text article views including HTML views, PDF and ePub downloads, according to the available data) and Abstracts Views on Vision4Press platform.
Data correspond to usage on the plateform after 2015. The current usage metrics is available 48-96 hours after online publication and is updated daily on week days.
Initial download of the metrics may take a while.