Fig. 11
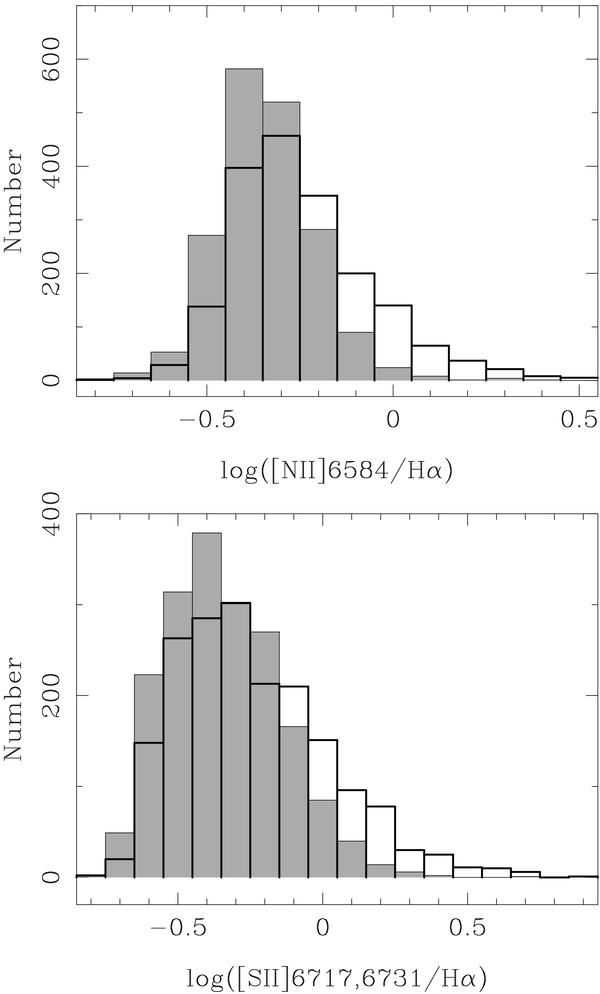
Histograms showing the distributions of the spatially resolved [N ii]λ6584/Hα (upper panel) and [S ii]λλ6717, 6731/Hα (lower panel) line ratios for the full PMAS sample, for a total of 1852 spaxels. The thick line empty histograms are the observed line ratios, while the thin line filled histograms are the line ratios corrected for stellar absorption.
Current usage metrics show cumulative count of Article Views (full-text article views including HTML views, PDF and ePub downloads, according to the available data) and Abstracts Views on Vision4Press platform.
Data correspond to usage on the plateform after 2015. The current usage metrics is available 48-96 hours after online publication and is updated daily on week days.
Initial download of the metrics may take a while.