Fig. 9
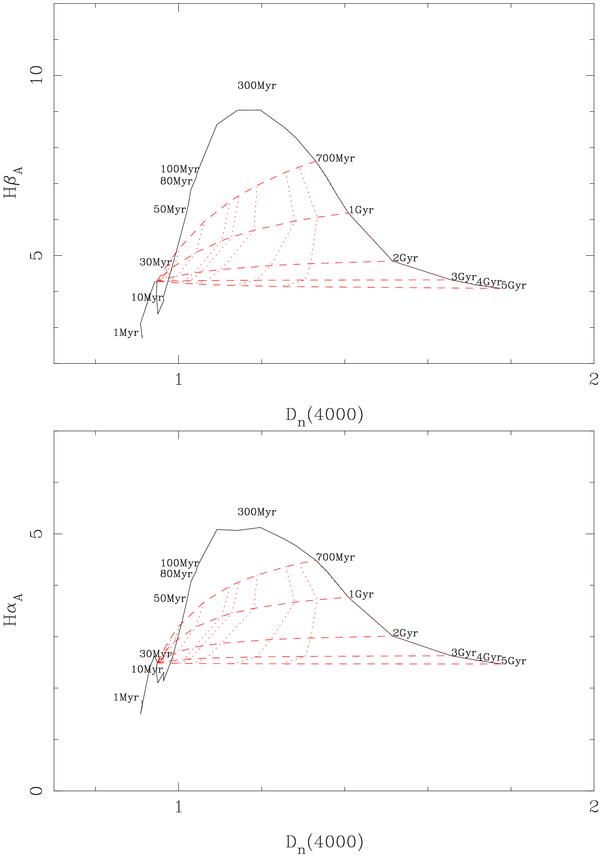
Theoretical Dn(4000) vs. HβA (upper panel) and Dn(4000) vs. HαA (lower panel) diagrams. The black solid line is the time evolution (from 1 Myr to 5 Gyr) as predicted by the BC03 models using solar metallicity, a Salpeter IMF, and an instantaneous burst of star formation. The dashed lines are combinations of different evolved populations (ages 700 Myr, 1 Gyr, 2 Gyr, 3 Gyr, and 5 Gyr) and a young ionizing stellar population of 6 Myr. The dotted lines represent the contribution in mass of the two stellar populations, as in Fig. 6.
Current usage metrics show cumulative count of Article Views (full-text article views including HTML views, PDF and ePub downloads, according to the available data) and Abstracts Views on Vision4Press platform.
Data correspond to usage on the plateform after 2015. The current usage metrics is available 48-96 hours after online publication and is updated daily on week days.
Initial download of the metrics may take a while.