Fig. 5
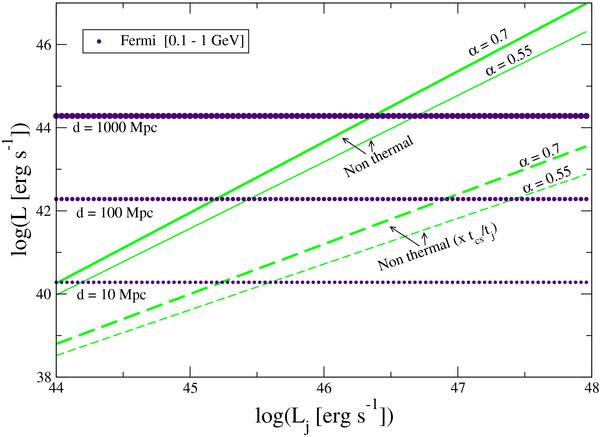
Upper limits to the gamma-ray luminosity produced by  clouds inside the jet as a function of Lj in FR II sources. Two cases are plotted, one assuming that clouds cross the jet without disruption (green solid lines), and one in which the clouds are destroyed in a time as short as tcs (green dashed lines). The thick (solid and dashed) and thin (solid and dashed) lines correspond to
  (Kaspi et al. 2007) and
  (Kaspi et al. 2005), respectively. In addition, the sensitivity levels of Fermi in the range 0.1–1 GeV (maroon dotted lines) are plotted for three different distances d = 10, 100, and 1000 Mpc.
Current usage metrics show cumulative count of Article Views (full-text article views including HTML views, PDF and ePub downloads, according to the available data) and Abstracts Views on Vision4Press platform.
Data correspond to usage on the plateform after 2015. The current usage metrics is available 48-96 hours after online publication and is updated daily on week days.
Initial download of the metrics may take a while.