Fig. 3
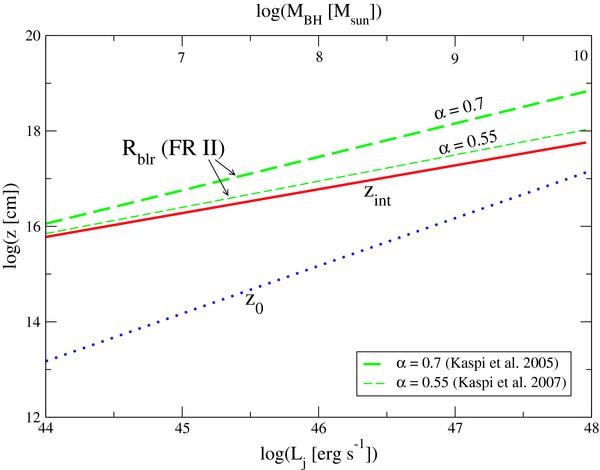
The interaction height, zint (red solid line), and the size of the BLR, Rblr (green dashed line), for different values of Lj (bottom horizontal axis). We have derived Rblr(Lj) fixing Lblr = 0.1Lj and plotted Rblr using Eqs. (11) and (12). In the same plot, the height of the jet base, z0 (blue dotted line), is plotted as a function of MBH (top horizontal axis).
Current usage metrics show cumulative count of Article Views (full-text article views including HTML views, PDF and ePub downloads, according to the available data) and Abstracts Views on Vision4Press platform.
Data correspond to usage on the plateform after 2015. The current usage metrics is available 48-96 hours after online publication and is updated daily on week days.
Initial download of the metrics may take a while.