Free Access
Fig. A.3
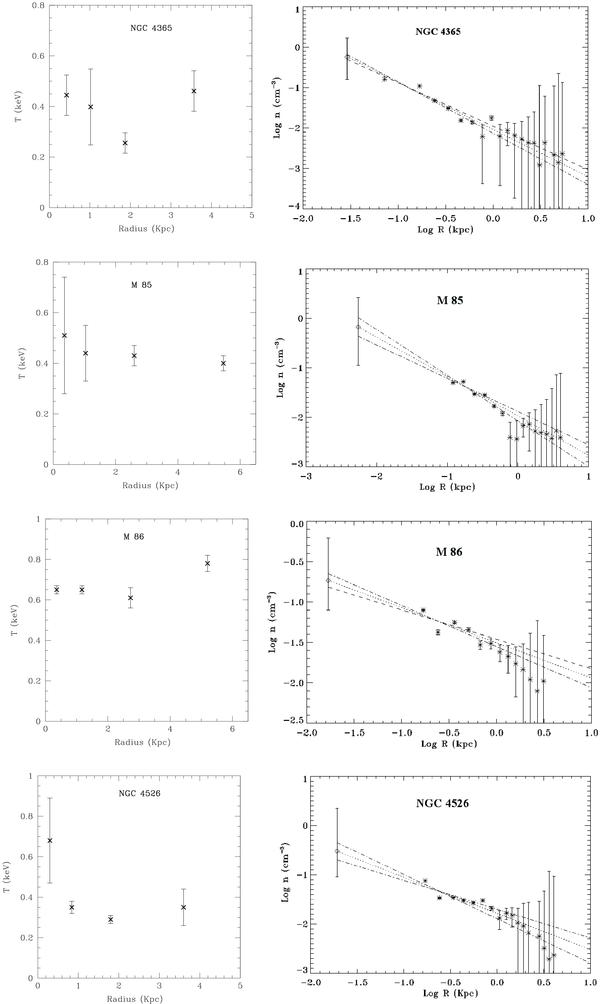
Deprojected temperature (left panels) and density (right panels) profiles of the four VCC galaxies. The two dotted lines in each figure are the linear fits on the innermost data points, used for the extrapolation of the density to the Bondi radius.
Current usage metrics show cumulative count of Article Views (full-text article views including HTML views, PDF and ePub downloads, according to the available data) and Abstracts Views on Vision4Press platform.
Data correspond to usage on the plateform after 2015. The current usage metrics is available 48-96 hours after online publication and is updated daily on week days.
Initial download of the metrics may take a while.