Free Access
Fig. A.2
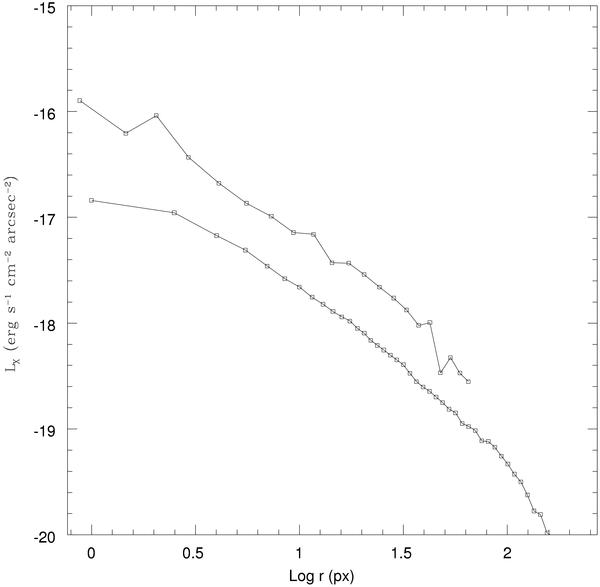
X-ray brightness profile of NGC 4365, as obtained from the Chandra observations (upper curve). The lower curve is an estimate of the contribution of X-ray emission from old active stars calculated scaling the K band surface brightness profile by using Eq. (A.1).
Current usage metrics show cumulative count of Article Views (full-text article views including HTML views, PDF and ePub downloads, according to the available data) and Abstracts Views on Vision4Press platform.
Data correspond to usage on the plateform after 2015. The current usage metrics is available 48-96 hours after online publication and is updated daily on week days.
Initial download of the metrics may take a while.