Fig. 6
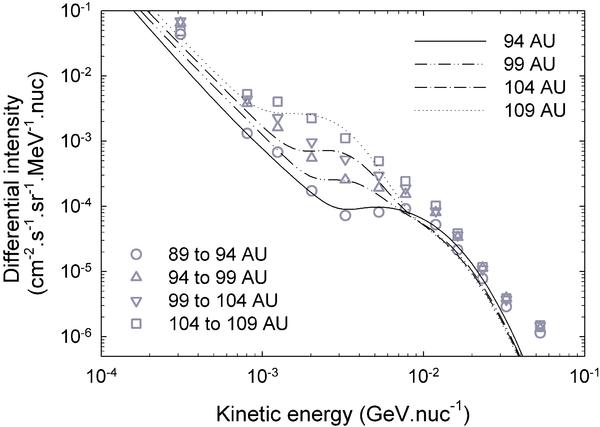
A comparison between modelled energy spectra and V1 O* observations in the heliosheath. The modelling results are for the qA < 0 magnetic polarity cycle and shown at a polar angle of 55°. The data symbols are long term averaged O energy spectra for four 5-AU-wide radial ranges (as shown) and reveal the energetic particle behaviour at V1, immediately upstream of the TS and in the heliosheath. From smallest to largest distances the four periods are 2003/220-2004/346, 2004/353-2006/124, 2006/125-2007/259, and 2007/260-2009/028 (where the year and day of year are indicated). Note that the statistical uncertainties are smaller than the symbol sizes. The modelled spectra are plotted at positions near the centre of each radial bin, as given.
Current usage metrics show cumulative count of Article Views (full-text article views including HTML views, PDF and ePub downloads, according to the available data) and Abstracts Views on Vision4Press platform.
Data correspond to usage on the plateform after 2015. The current usage metrics is available 48-96 hours after online publication and is updated daily on week days.
Initial download of the metrics may take a while.