Fig. 5
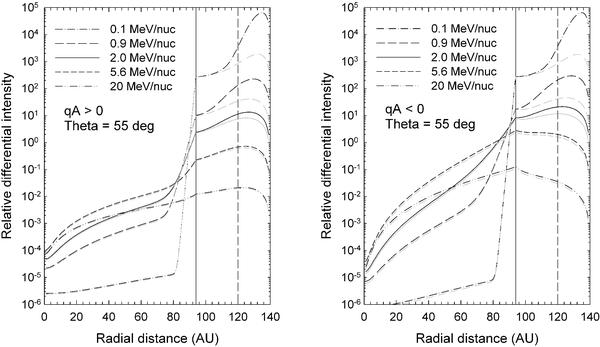
Modelled O* intensities as a function of radial distance at various energies for both polarity cycles at a polar angle of 55°. The position of the TS is indicated by the vertical line. The grey lines correspond to only adiabatic heating occurring in the heliosheath (i.e. κP,0 = 0.0), while the black lines include Fermi II acceleration (i.e. κP,0 = 0.5). The vertical dashed line shows the approximate position (at r = 120 AU) where non-radial solar wind flow may begin to dominate.
Current usage metrics show cumulative count of Article Views (full-text article views including HTML views, PDF and ePub downloads, according to the available data) and Abstracts Views on Vision4Press platform.
Data correspond to usage on the plateform after 2015. The current usage metrics is available 48-96 hours after online publication and is updated daily on week days.
Initial download of the metrics may take a while.