Fig. 5
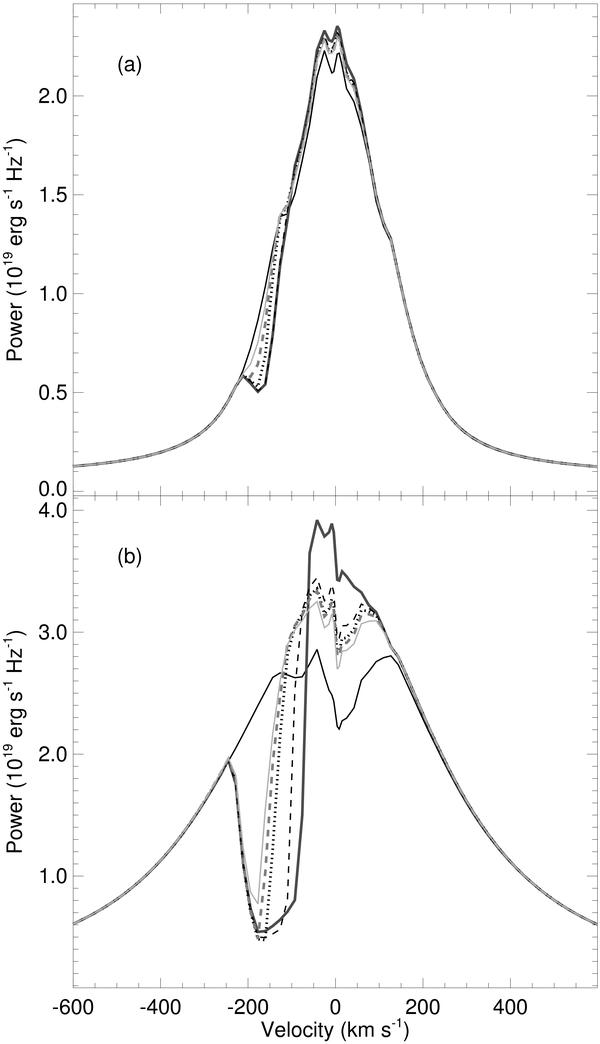
Hα profiles for a) Ṁacc = 10-8 M⊙yr-1, and b) Ṁacc = 10-7 M⊙yr-1, with Tmag,MAX = 9000 K and Twind,MAX = 10000 K. In all plots the value of ρ0 is kept constant at a value which makes Ṁloss ≈ 0.1 Ṁacc, when rdo = 30.0 R∗. The black thin solid lines are the line profiles with only the magnetosphere; the thick darkgrey solid lines are the line profiles when magnetosphere and disk wind are considered and rdo = 30.0 R∗. The other curves show the line profiles when rdo = 10.0 R∗ (thin black dashed lines), rdo = 5.0 R∗ (thin black dotted line), rdo = 4.0 R∗ (dark grey thin dashed line) and rdo = 3.5 R∗ (light grey thin solid line).
Current usage metrics show cumulative count of Article Views (full-text article views including HTML views, PDF and ePub downloads, according to the available data) and Abstracts Views on Vision4Press platform.
Data correspond to usage on the plateform after 2015. The current usage metrics is available 48-96 hours after online publication and is updated daily on week days.
Initial download of the metrics may take a while.