Fig. 2
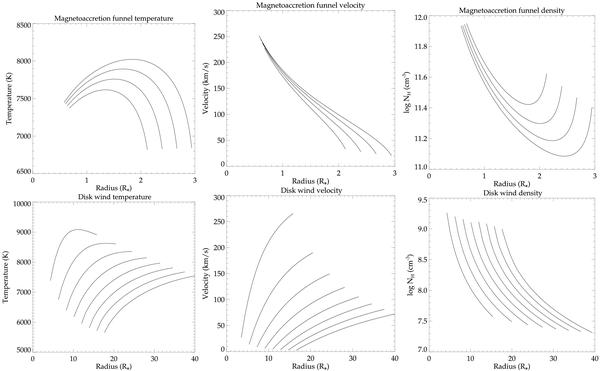
Temperature (left), poloidal velocity (middle), and density (right) profiles along streamlines inside the magnetosphere (top) and along streamlines inside the disk wind region (bottom). In all plots the x-axis represents the system cylindrical radius in units of stellar radii R∗. The maximum temperature inside the magnetosphere is Tmag,MAX ≃ 8000K, and inside the disk wind it is Twind,MAX ≃ 9000K. Only some of the streamlines are shown in the plots, and they are the same ones in the left, middle, and right plots.
Current usage metrics show cumulative count of Article Views (full-text article views including HTML views, PDF and ePub downloads, according to the available data) and Abstracts Views on Vision4Press platform.
Data correspond to usage on the plateform after 2015. The current usage metrics is available 48-96 hours after online publication and is updated daily on week days.
Initial download of the metrics may take a while.