Fig. 8
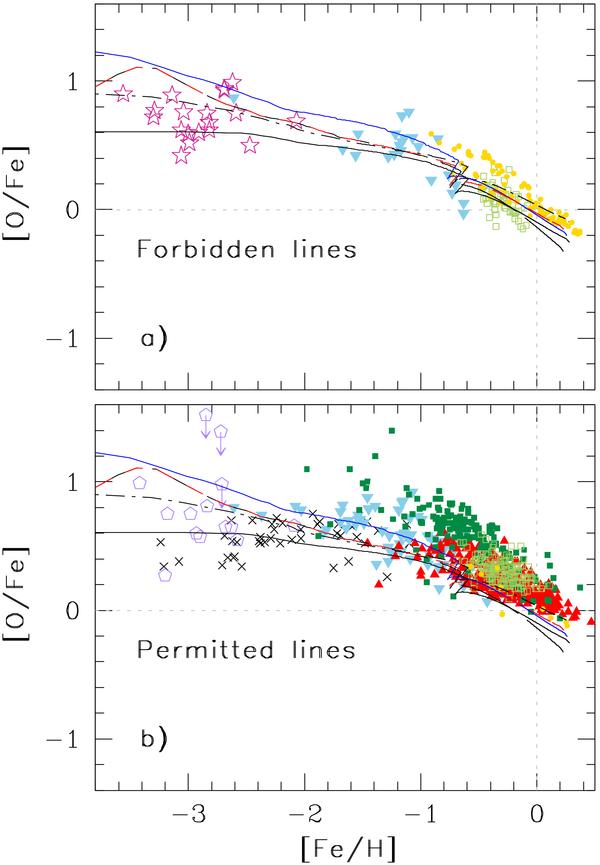
[O/Fe] versus [Fe/H] in the solar neighbourhood. Theoretical predictions are from Models 1 [short-dashed (red) lines], 3 [long-dashed (black) lines], 4 [upper (blue) solid lines], 5 [lower (black) solid lines], and 6 [dot-dashed (black) lines]. Upper panel: oxygen abundances from the forbidden [O i] lines from Cayrel et al. (2004, stars), Gratton et al. (2003, upside-down triangles), Reddy et al. (2003, open squares), and Bensby et al. (2005, filled circles). Lower panel: oxygen abundances from other indicators from Lai et al. (2008, open pentagons), Fabbian et al. (2009, crosses), Gratton et al. (2003, upside-down triangles), Reddy et al. (2006, filled squares), Reddy et al. (2003, open squares), Ramírez et al. (2007, triangles), and Bensby et al. (2005, filled circles). See the electronic edition of the journal for a colour version of this figure.
Current usage metrics show cumulative count of Article Views (full-text article views including HTML views, PDF and ePub downloads, according to the available data) and Abstracts Views on Vision4Press platform.
Data correspond to usage on the plateform after 2015. The current usage metrics is available 48-96 hours after online publication and is updated daily on week days.
Initial download of the metrics may take a while.