Fig. 4
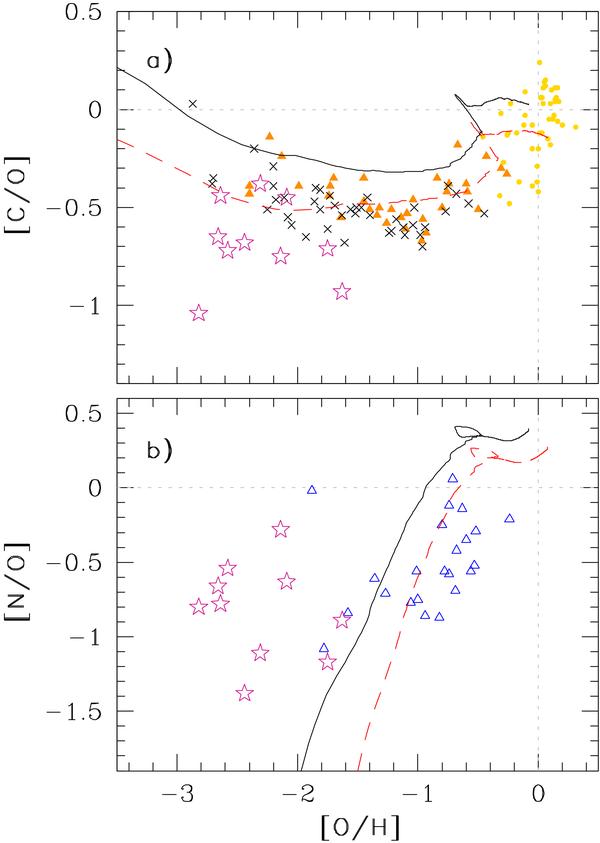
Carbon-to-oxygen (upper panel) and nitrogen-to-oxygen (lower panel) as functions of [O/H] in the solar neighbourhood. Data (symbols) are the same as in Fig. 3. Also shown are the predictions from Models 1 (short-dashed lines) and 2 (solid lines). The two models differ only in the adopted location of the mass cut in models of SNII explosions. See the electronic edition of the journal for a colour version of this figure.
Current usage metrics show cumulative count of Article Views (full-text article views including HTML views, PDF and ePub downloads, according to the available data) and Abstracts Views on Vision4Press platform.
Data correspond to usage on the plateform after 2015. The current usage metrics is available 48-96 hours after online publication and is updated daily on week days.
Initial download of the metrics may take a while.