Fig. 18
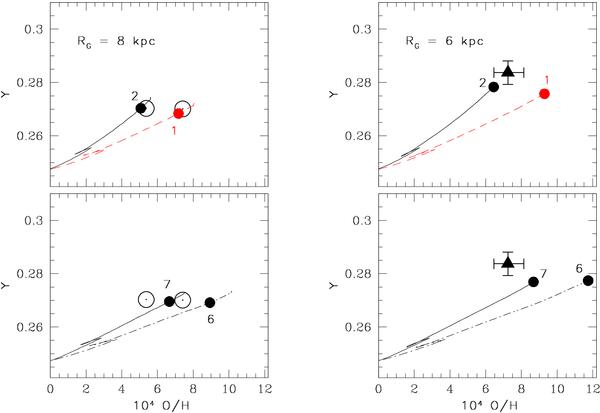
Y versus 104 O/H in the solar vicinity (left panels) and in the inner disc (RG = 6 kpc; right panels), as predicted by models with different nucleosynthesis prescriptions. Top panels: Model 1 [short-dashed (red) lines] versus Model 2 [solid (black) lines], showing the effect of changing the mass cut in models of SNII explosions. Bottom panels: Model 6 [dot-dashed (black) lines] versus Model 7 [solid (black) lines], with and without rotation in high-mass stars, respectively. Left panels: the filled circles on each theoretical track indicate the Y and 104 O/H values predicted at the time of the birth of the Sun, 4.5 Gyr ago. These are compared with the bulk (initial) abundances of He and O in the Sun (Sun symbols, from Grevesse & Sauval 1998 – higher O abundance – and Asplund et al. 2009 – lower O abundance). The effects of diffusion are taken into account in defining the protosolar abundances displayed in the figure (see the discussion in Asplund et al. 2009). Right panels: the final Y and 104 O/H values attained by the models are highlighted (filled circles) and compared to the abundances of He and O measured for M 17, an H ii region located at 2.1 kpc distance from the Sun (filled triangles; see text for discussion).
Current usage metrics show cumulative count of Article Views (full-text article views including HTML views, PDF and ePub downloads, according to the available data) and Abstracts Views on Vision4Press platform.
Data correspond to usage on the plateform after 2015. The current usage metrics is available 48-96 hours after online publication and is updated daily on week days.
Initial download of the metrics may take a while.