Fig. 15
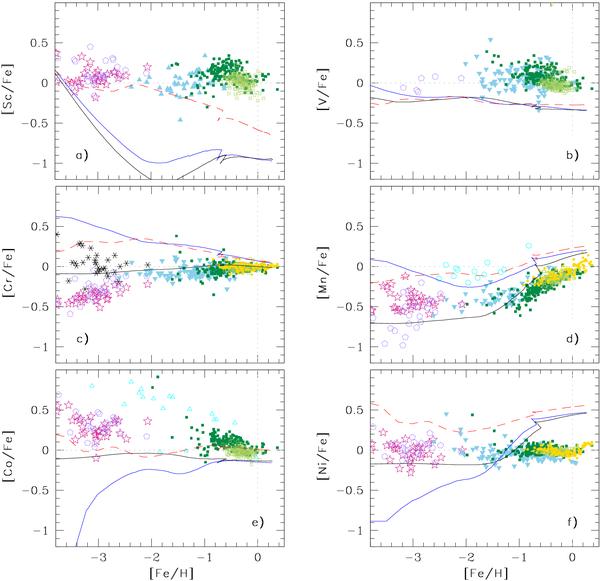
Predicted behaviour of the relative ratios of several Fe-peak elements to iron (panel a): scandium, panel b): vanadium, panel c): chromium, panel d): manganese, panel e): cobalt, panel f): nickel) with respect to the relative iron abundance in the solar neighbourhood, for Models 1 [short-dashed (red) lines], 4 [upper solid (blue) lines for Sc, V, Cr, and Mn; lower solid (blue) lines for Co and Ni], and 5 [lower solid (black) lines for Sc, V, Cr, and Mn; upper solid (black) lines for Co and Ni]. Also shown are data from Cayrel et al. (2004, stars), Lai et al. (2008, open pentagons), Bonifacio et al. (2009, asterisks, for Cr from Cr ii , Bergemann & Gehren (2008, open circles), Bergemann et al. (2010, open triangles), Gratton et al. (2003, upside-down triangles), Reddy et al. (2006, filled squares), Reddy et al. (2003, open squares), Bensby et al. (2005, filled circles, only for Cr and Ni), and Feltzing et al. (2007, filled circles, only for Mn). Bergemann & Gehren (2008) and Bergemann et al. (2010) performed non-LTE calculations; all the other abundance studies, instead, rely on the assumption of LTE. See the electronic edition of the journal for a colour version of this figure.
Current usage metrics show cumulative count of Article Views (full-text article views including HTML views, PDF and ePub downloads, according to the available data) and Abstracts Views on Vision4Press platform.
Data correspond to usage on the plateform after 2015. The current usage metrics is available 48-96 hours after online publication and is updated daily on week days.
Initial download of the metrics may take a while.