Fig. 7
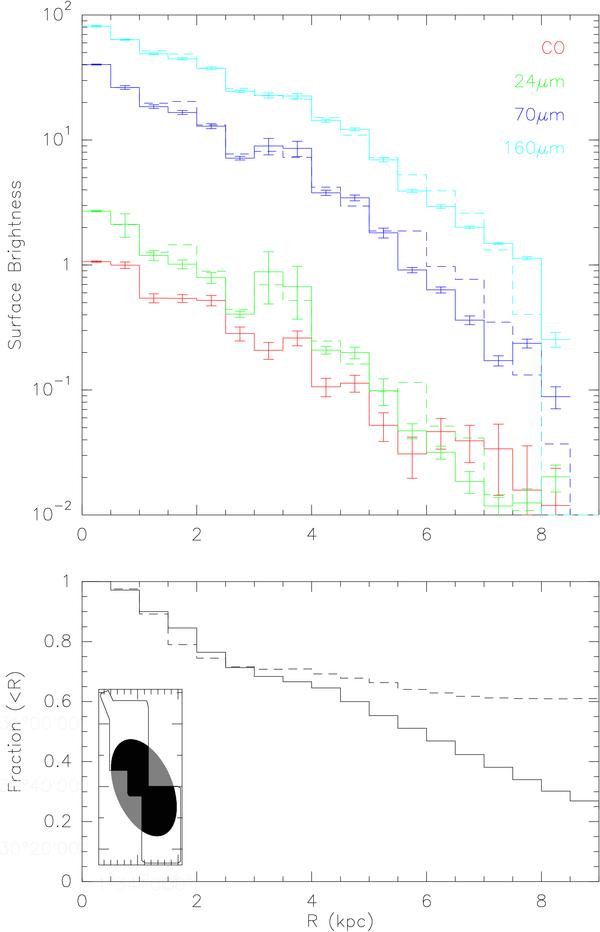
(Color online) Top: radial distribution of the CO and IR surface brightness in units of MJy sr-1 for infrared data and K km s-1 for CO. For the dust tracers, the surface brightness is computed both on the region covered by our CO observations (solid line) and on the whole elliptic annuli for each radius (dashed lines), showing that our CO sampled area is representative of the galaxy for each radius. Bottom: cumulative fractions of the area (solid line) and 70 μm surface brightness (dashed line) in the region covered by our CO observations (black area in the lower left diagram) compared to the whole elliptic region of radius less than R (sum of grey and black areas at a given R).
Current usage metrics show cumulative count of Article Views (full-text article views including HTML views, PDF and ePub downloads, according to the available data) and Abstracts Views on Vision4Press platform.
Data correspond to usage on the plateform after 2015. The current usage metrics is available 48-96 hours after online publication and is updated daily on week days.
Initial download of the metrics may take a while.