Fig. 3
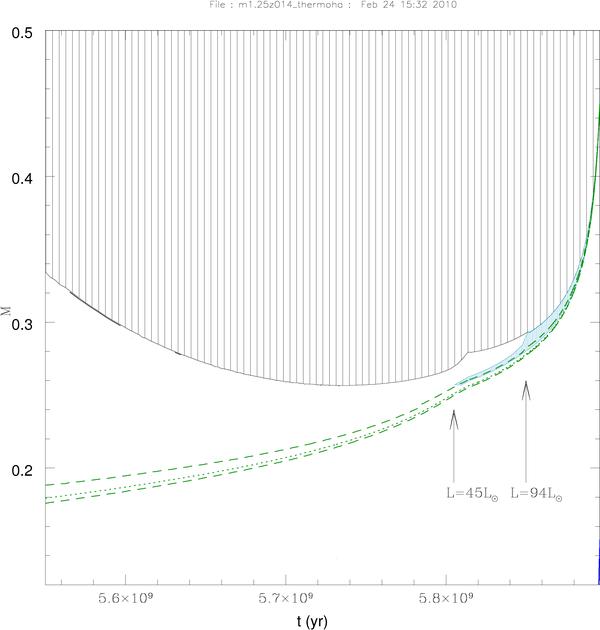
Kippenhahn diagram for the 1.25 M⊙ star computed with thermohaline mixing (no rotation-induced processes). Here we focus on the evolution phase around the RGB luminosity bump (located at a total stellar luminosity of ~ 45 L⊙ as indicated by the left arrow). Hatched area is the convective envelope. Green dotted lines delimit the hydrogen-burning shell above the degenerate helium core. The zone where the thermohaline instability develops is shown in hatched blue. The right arrow indicates the total stellar luminosity (Lc,th ~ 94 L⊙) at which the thermohaline region extends up to the convective envelope and thus when the surface chemical composition starts changing.
Current usage metrics show cumulative count of Article Views (full-text article views including HTML views, PDF and ePub downloads, according to the available data) and Abstracts Views on Vision4Press platform.
Data correspond to usage on the plateform after 2015. The current usage metrics is available 48-96 hours after online publication and is updated daily on week days.
Initial download of the metrics may take a while.