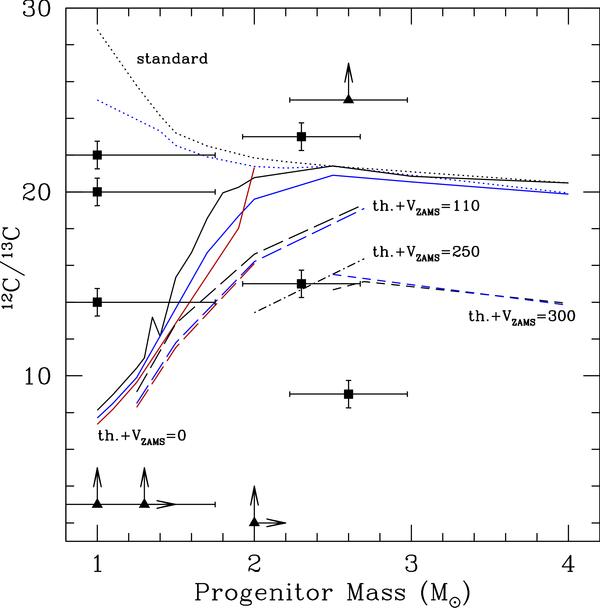
Fig. 18

Observations of 12C/13C in planetary nebulae as a function of the progenitor mass (Palla et al. 2000). Squares and triangles are respectively for actual determinations and lower limits of the carbon isotopic ratio. Black and blue theoretical lines have the same meaning as in Fig. 17, while red curves show the model predictions at the AGB tip for the low-mass models that were computed up to that phase (solid and dashed red curves are respectively for the models with thermohaline mixing only and for the models with thermohaline and rotation-induced mixing).
Current usage metrics show cumulative count of Article Views (full-text article views including HTML views, PDF and ePub downloads, according to the available data) and Abstracts Views on Vision4Press platform.
Data correspond to usage on the plateform after 2015. The current usage metrics is available 48-96 hours after online publication and is updated daily on week days.
Initial download of the metrics may take a while.


