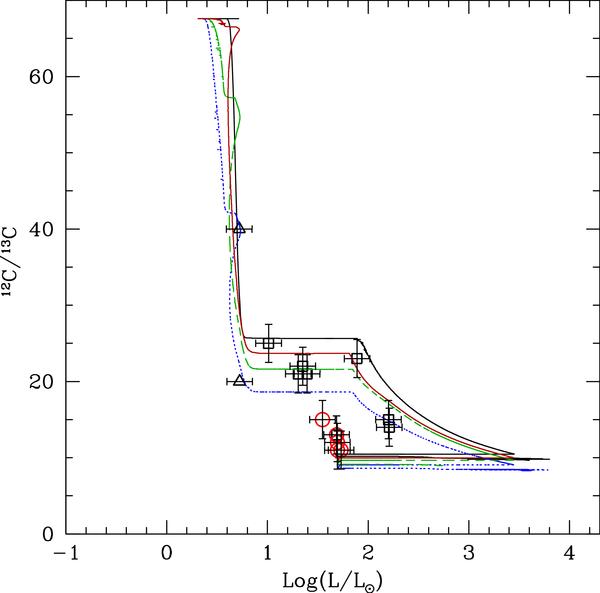
Fig. 16

Evolution of the surface 12C/13C value as a function of stellar luminosity for the 1.25 M⊙ models including thermohaline instability and rotation-induced mixing (for initial rotation velocities of 50, 80, and 110 km s-1 shown as solid red, dashed green, and dotted blue lines respectively). The non rotating case is also shown (black solid line). Observations along the evolutionary sequence of the open cluster M 67 are from Gilroy & Brown (1991). The triangle is for a subgiant star for which only a lower value could be obtained, while black squares and red circles correspond respectively to RGB and clump stars.
Current usage metrics show cumulative count of Article Views (full-text article views including HTML views, PDF and ePub downloads, according to the available data) and Abstracts Views on Vision4Press platform.
Data correspond to usage on the plateform after 2015. The current usage metrics is available 48-96 hours after online publication and is updated daily on week days.
Initial download of the metrics may take a while.


