Fig. 10
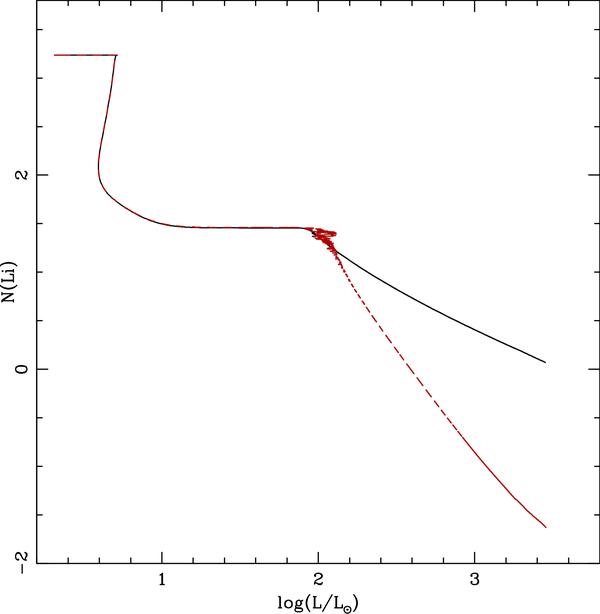
Evolution of the surface abundance of 7Li in the 1.25 M⊙ star up to the RGB tip when considering thermohaline transport but no rotation-induced mixing. The black solid and red dashed curves correspond to computations performed with Ct = 103 and 104 respectively.
Current usage metrics show cumulative count of Article Views (full-text article views including HTML views, PDF and ePub downloads, according to the available data) and Abstracts Views on Vision4Press platform.
Data correspond to usage on the plateform after 2015. The current usage metrics is available 48-96 hours after online publication and is updated daily on week days.
Initial download of the metrics may take a while.