Fig. 1
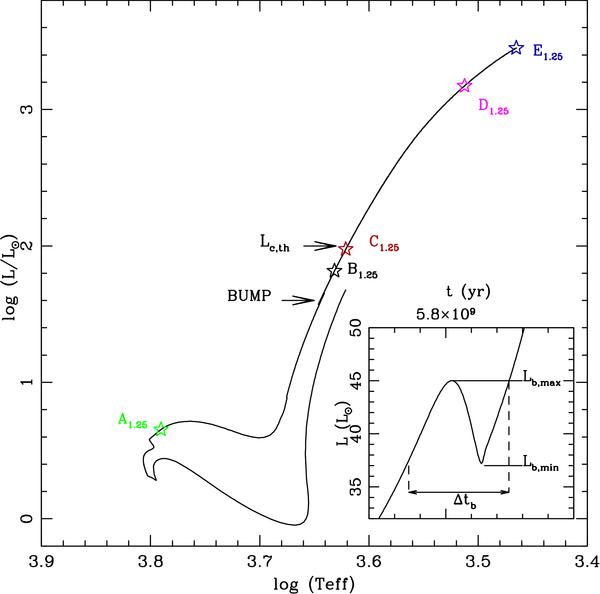
Evolutionary track (from the pre-main sequence up to the tip of the RGB) of the 1.25 M⊙ model computed with thermohaline mixing only. The minimum and maximum luminosity of the bump are indicated (Lb,min and Lb,max respectively) as well as the luminosity Lc,th at which the thermohaline instability reaches the bottom of the convective envelope. Open symbols labelled A1.25 to E1.25 correspond to evolution points for which some stellar properties are discussed in the text. The panel inserted on the right of the figure shows the evolution of the stellar luminosity around the bump as a function of time. Δtb is the time spend by the star within the luminosity bump and equals to 3.9 × 10⁷ yrs in the present case.
Current usage metrics show cumulative count of Article Views (full-text article views including HTML views, PDF and ePub downloads, according to the available data) and Abstracts Views on Vision4Press platform.
Data correspond to usage on the plateform after 2015. The current usage metrics is available 48-96 hours after online publication and is updated daily on week days.
Initial download of the metrics may take a while.