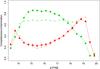
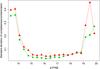
Fig. 7

Top: completeness (green squares) and contamination (red triangles) for sources of different magnitudes classified with the kNN technique. One hundred separate trials were averaged to produce this plot. The filled symbols and solid lines show the results using the 2d prior. The open symbols and dashed lines show the results using the simple prior only. Bottom: standard deviations of completeness and contamination at each point.
Current usage metrics show cumulative count of Article Views (full-text article views including HTML views, PDF and ePub downloads, according to the available data) and Abstracts Views on Vision4Press platform.
Data correspond to usage on the plateform after 2015. The current usage metrics is available 48-96 hours after online publication and is updated daily on week days.
Initial download of the metrics may take a while.