Fig. 20
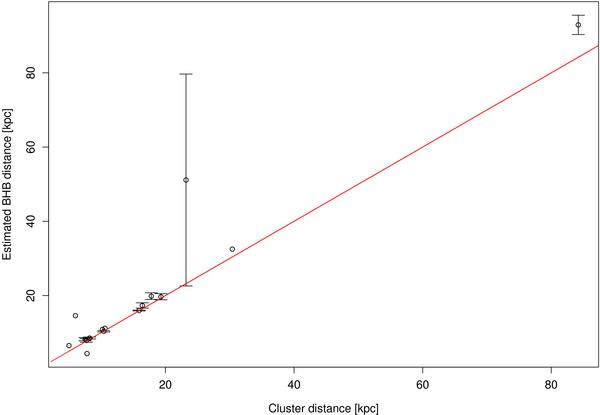
Distances to globular clusters taken from the catalogue of Harris compared to the mean distance to BHB stars within one tidal radius of the cluster centre (both quantities taken from Harris. The straight line shows exact agreement (x = y). Error bars are plotted where possible (> 1 source identified). The main plot shows the full sample, the inset shows the portion closer than 30 kpc at a larger scale. Globular clusters with no detected BHB population are not shown.
Current usage metrics show cumulative count of Article Views (full-text article views including HTML views, PDF and ePub downloads, according to the available data) and Abstracts Views on Vision4Press platform.
Data correspond to usage on the plateform after 2015. The current usage metrics is available 48-96 hours after online publication and is updated daily on week days.
Initial download of the metrics may take a while.