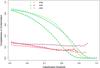
Fig. 13

Top: completeness (green) and contamination (red) for test samples with 15 < g < 17 classified with the SVM, KDE or kNN. Different shades and symbols are used to distinguish the methods. All results are modified with the 2d prior and the contamination is corrected for class fractions. Results are the average of ten independent runs. Bottom: same data as in the top plot, with completeness plotted directly against contamination for direct comparison. The SVM results are always below and to the right of the other methods, demonstrating lower contamination for a given completeness.
Current usage metrics show cumulative count of Article Views (full-text article views including HTML views, PDF and ePub downloads, according to the available data) and Abstracts Views on Vision4Press platform.
Data correspond to usage on the plateform after 2015. The current usage metrics is available 48-96 hours after online publication and is updated daily on week days.
Initial download of the metrics may take a while.