Fig. 5
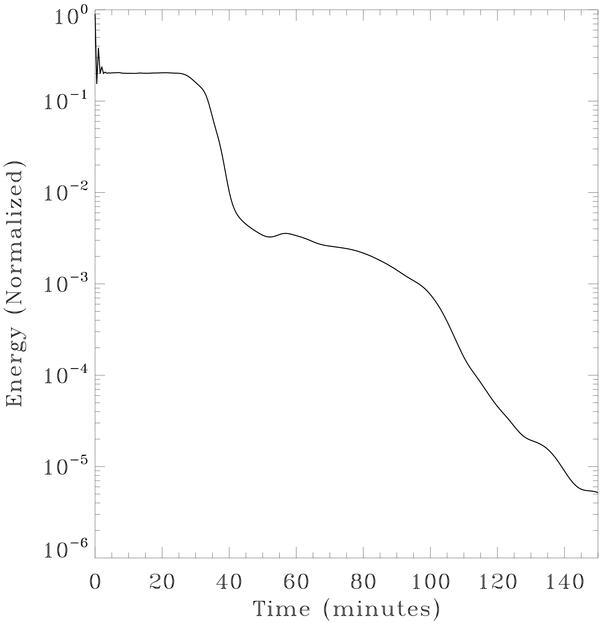
Time evolution of the normalized MHD wave energy as computed using Eqs. (34), summed over the entire grid. Because of the strong dispersive nature of the waves and large variations in the propagation speeds between the fast, slow, and Alfvén waves, some modes take a long time to reach the boundaries, resulting in a relatively extended energy decay process compared to Fig. 2. The initial drop at t ~ 20 − 40 min corresponds to the first arrivals of waves at the upper and lower absorption layers. The secondary decline may be associated with the arrivals of the downward propagating dispersing slow and Alfvén modes at the absorption layer adjacent to the lower boundary.
Current usage metrics show cumulative count of Article Views (full-text article views including HTML views, PDF and ePub downloads, according to the available data) and Abstracts Views on Vision4Press platform.
Data correspond to usage on the plateform after 2015. The current usage metrics is available 48-96 hours after online publication and is updated daily on week days.
Initial download of the metrics may take a while.