Fig. 4
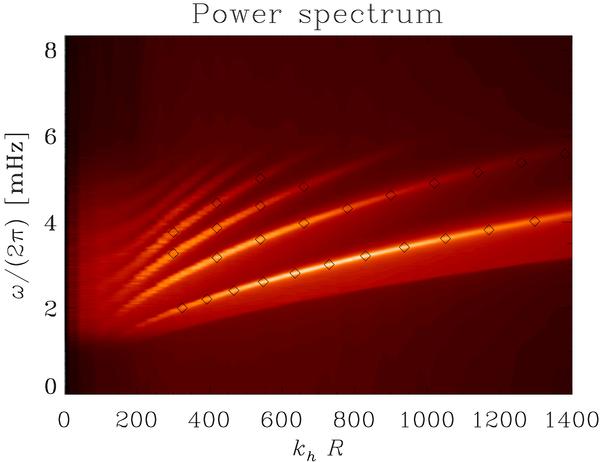
Modal power spectrum extracted of the vertical velocity component extracted at a height of z = 200 km above the photosphere, from a 12 h long simulation with the boundaries lined by sponges(plotted on a linear scale). The weak reflections from the lower boundary cause the dispersion relation to change in curvature at all points for which ν / (kh R⊙) exceeds a certain threshold. The symbols are the same as those in Fig. 3; note that there are differences between the C-PML and sponge layered simulations at high frequencies. This is because these high-frequency waves are sensitive to the upper boundary.
Current usage metrics show cumulative count of Article Views (full-text article views including HTML views, PDF and ePub downloads, according to the available data) and Abstracts Views on Vision4Press platform.
Data correspond to usage on the plateform after 2015. The current usage metrics is available 48-96 hours after online publication and is updated daily on week days.
Initial download of the metrics may take a while.