Fig. 3
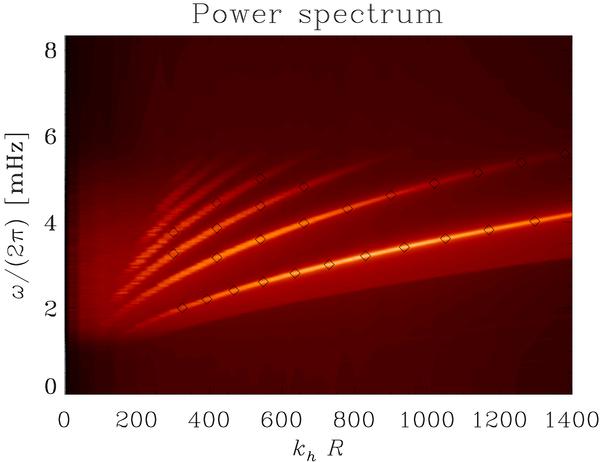
Modal power spectrum of the vertical velocity component extracted at a height of z = 200 km above the photosphere, from a 12 h long simulation with C-PMLs placed at the upper and lower boundaries(plotted on a linear scale). The horizontal axis is the normalized wavenumber, the vertical is frequency, and regions of high power are the normal modes that appear in the calculation. The symbols overplotted on the power contours are the theoretically expected values of the resonant frequencies, computed using the MATLAB boundary value problem solver bvp4c.
Current usage metrics show cumulative count of Article Views (full-text article views including HTML views, PDF and ePub downloads, according to the available data) and Abstracts Views on Vision4Press platform.
Data correspond to usage on the plateform after 2015. The current usage metrics is available 48-96 hours after online publication and is updated daily on week days.
Initial download of the metrics may take a while.