Fig. 3
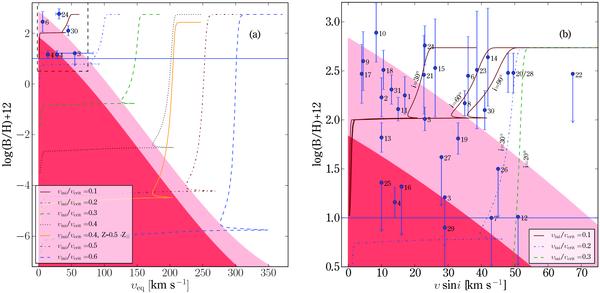
Boron versus equatorial velocity for 12 M⊙ models with different rotation velocities. The stars from the chosen sample with known rotational velocities are shown in a) and all stars with their υsini in b). The horizontal line indicates the minimum boron abundance that can still be detected. In a) the dashed rectangle illustrates the section shown in b). The red hatched area shows the evolution region for the post MS phases of our models (assuming i = 90°), whereas the light red area could still be on the MS for models with sub-solar Z. The stars are labelled by the number given in the first column of Tables 3 and 4. Star 4 has either υeq = 14 or 28 km s-1 (see Aerts et al. 2006). In b) the curves depict models with different inclination angles.
Current usage metrics show cumulative count of Article Views (full-text article views including HTML views, PDF and ePub downloads, according to the available data) and Abstracts Views on Vision4Press platform.
Data correspond to usage on the plateform after 2015. The current usage metrics is available 48-96 hours after online publication and is updated daily on week days.
Initial download of the metrics may take a while.