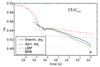
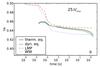
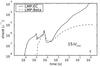
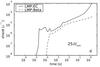
Fig. 7

The electron fraction (upper plots), the electron-capture, and beta-decay rates (bottom plots) as a function of time till collapse are shown for two presupernova models: 15 M⊙ (left) and 25 M⊙ (right). In the electron fraction plots the dotted lines (blue) and dashed lines (red) were already shown by Heger et al. (2001a) and correspond to the old models of Woosley & Weaver (1995) and to the new ones of Heger et al. (2001b), respectively. Here we have added the solid lines, which results from assuming NSE and thermal weak equilibrium (solid black line) or dynamic beta-equilibrium (solid green line).
Current usage metrics show cumulative count of Article Views (full-text article views including HTML views, PDF and ePub downloads, according to the available data) and Abstracts Views on Vision4Press platform.
Data correspond to usage on the plateform after 2015. The current usage metrics is available 48-96 hours after online publication and is updated daily on week days.
Initial download of the metrics may take a while.