Free Access
Fig. 2
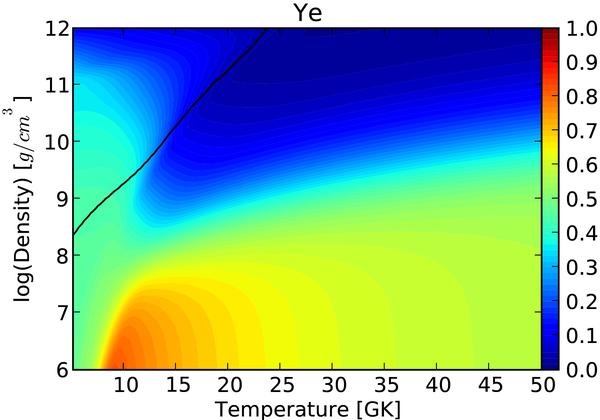
The electron fraction for NSE with dynamic beta-equilibrium is shown by color
contours for the same range as in Fig. 1. The
black line represent the region where  .
.
Current usage metrics show cumulative count of Article Views (full-text article views including HTML views, PDF and ePub downloads, according to the available data) and Abstracts Views on Vision4Press platform.
Data correspond to usage on the plateform after 2015. The current usage metrics is available 48-96 hours after online publication and is updated daily on week days.
Initial download of the metrics may take a while.