Fig. 1
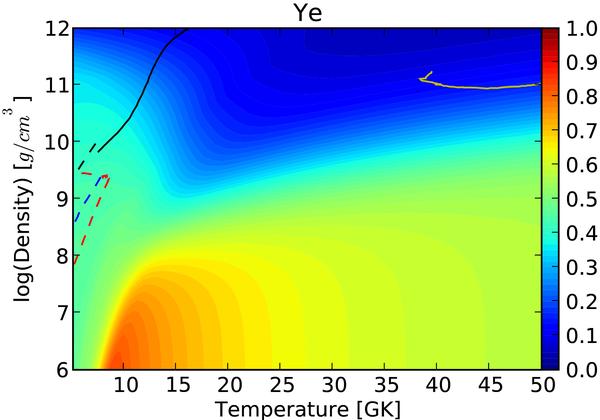
The electron fraction for NSE with thermal weak equilibrium is shown by color contours for a range of densities and temperatures where NSE can be applied and which are relevant in different astrophysical scenarios. The solid black line shows the core-collapse trajectory for a 15 M⊙ (A. Marek, priv. com.); the dashed lines represent the presupernova evolution of a 15 M⊙ (black) and 25 M⊙ (blue) stars; the red dashed lines represent a type Ia trajectory (F. Röpke, priv. com.); and the solid yellow lines correspond to the evolution of the proto-neutron star surface. Not all these scenarios will reach beta equilibrium and their electron fraction can therefore be different to the one shown here.
Current usage metrics show cumulative count of Article Views (full-text article views including HTML views, PDF and ePub downloads, according to the available data) and Abstracts Views on Vision4Press platform.
Data correspond to usage on the plateform after 2015. The current usage metrics is available 48-96 hours after online publication and is updated daily on week days.
Initial download of the metrics may take a while.