Fig. 3
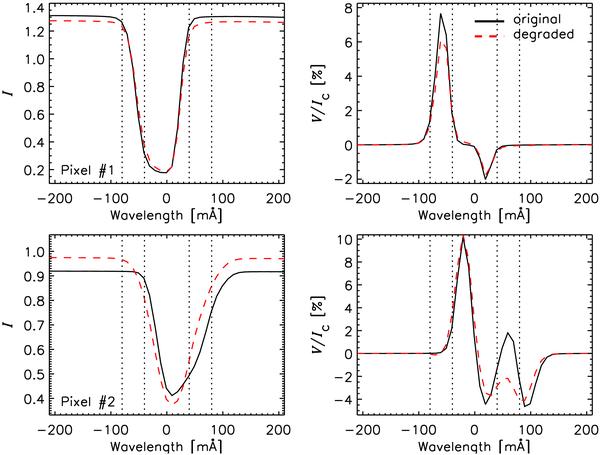
Stokes I and V profiles of Fe i 525.02 nm corresponding to pixels #1 (top) and 2 (bottom) in Fig. 1. The solid and dashed lines represent the original simulations and the maps degraded by telescope diffraction and CCD pixelation, respectively. The vertical lines indicate wavelength samples at [ ± 8, ± 4 ] pm from the central wavelength of the line. To make a pixel-to-pixel comparison, we have taken the Stokes profiles from the degraded data before binning the images to match the IMaX CCD pixel size. Therefore, dissimilarities are enhanced.
Current usage metrics show cumulative count of Article Views (full-text article views including HTML views, PDF and ePub downloads, according to the available data) and Abstracts Views on Vision4Press platform.
Data correspond to usage on the plateform after 2015. The current usage metrics is available 48-96 hours after online publication and is updated daily on week days.
Initial download of the metrics may take a while.