Fig. 7
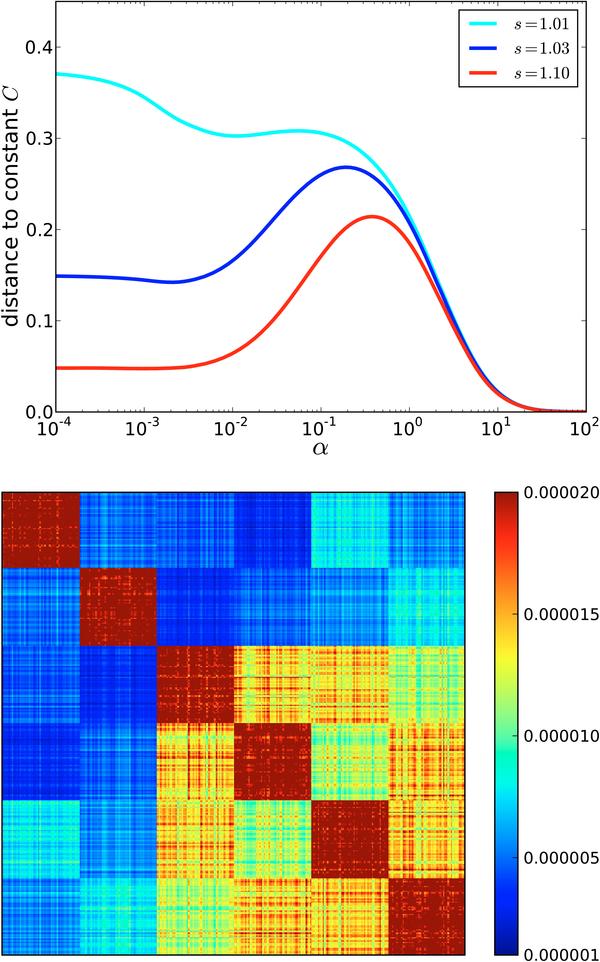
Estimating the optimal similarity measure for the example data of Fig. 6. Top panel: modified Manhattan distance C (Eq. (39)) for s = 1.01 (cyan line), s = 1.03 (blue line), and s = 1.1 (red line). For α → 0 the matrix becomes a step matrix, which is why the constant levels depend on the scale parameter. Bottom panel: the resulting similarity matrix.
Current usage metrics show cumulative count of Article Views (full-text article views including HTML views, PDF and ePub downloads, according to the available data) and Abstracts Views on Vision4Press platform.
Data correspond to usage on the plateform after 2015. The current usage metrics is available 48-96 hours after online publication and is updated daily on week days.
Initial download of the metrics may take a while.