Free Access
Fig. 5
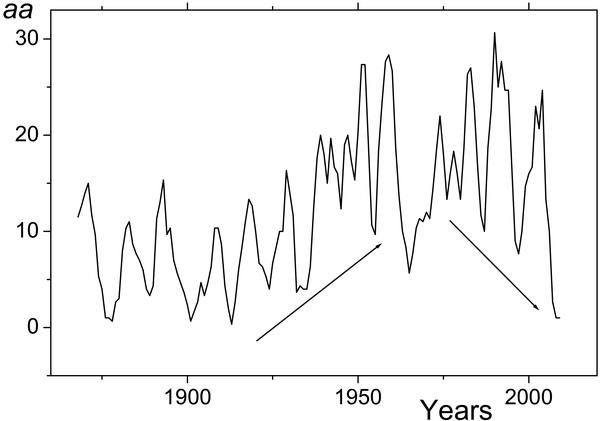
Annual mean of the geomagnetic indices aa from 1868 (according to the National Geophysical Data Center, NGDC), smoothed by 2 years. The arrows mark the index growth in the first half of the 20th century and the index decrease during the last decades for the solar activity minimum epochs.
Current usage metrics show cumulative count of Article Views (full-text article views including HTML views, PDF and ePub downloads, according to the available data) and Abstracts Views on Vision4Press platform.
Data correspond to usage on the plateform after 2015. The current usage metrics is available 48-96 hours after online publication and is updated daily on week days.
Initial download of the metrics may take a while.