Fig. 4
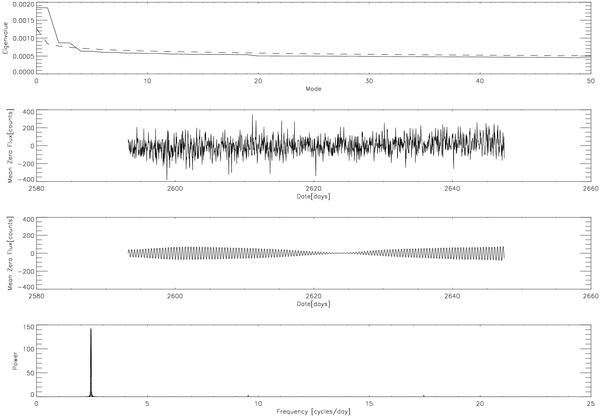
Top: the full line shows the singular spectrum and the dashed line shows an average of 100 runs of Monte Carlo simulation. 2nd row: smoothed time series (same as Fig. 1 – bottom). 3rd row: reconstructed time series using only the leading 4 eigenvalues, showing a strong beating effect. Bottom: Fourier transform of the reconstructed series. Note that the frequencies around 2.4 cd-1 are by far the dominant ones.
Current usage metrics show cumulative count of Article Views (full-text article views including HTML views, PDF and ePub downloads, according to the available data) and Abstracts Views on Vision4Press platform.
Data correspond to usage on the plateform after 2015. The current usage metrics is available 48-96 hours after online publication and is updated daily on week days.
Initial download of the metrics may take a while.