Fig. 5
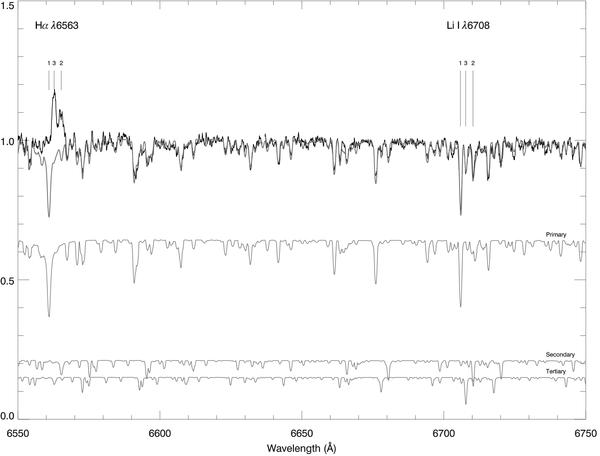
FEROS spectrum of the order containing Hα and the Li i doublet at 6708 Å. The solid black line is the observed spectrum. Overplotted is the three-component model spectrum (grey line). The model is a good match to the observed spectrum except near Hα where MML 53 shows emission and the model shows significant absorption. Plotted below are the three individual synthetic spectra with temperatures of 4886 K, 4309 K, and 4130 K for the primary, secondary and tertiary. They are scaled according to the derived R-band luminosity ratios of 0.64:0.21:0.15 and shifted by the velocity offsets found in the CCF analysis.
Current usage metrics show cumulative count of Article Views (full-text article views including HTML views, PDF and ePub downloads, according to the available data) and Abstracts Views on Vision4Press platform.
Data correspond to usage on the plateform after 2015. The current usage metrics is available 48-96 hours after online publication and is updated daily on week days.
Initial download of the metrics may take a while.