Fig. 1
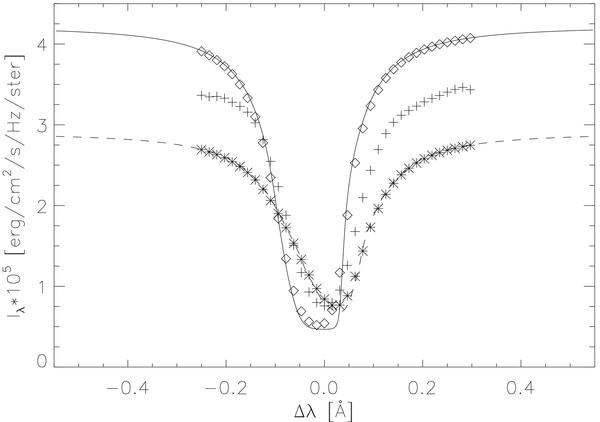
Fe i 5434 Å profiles for the atmospheres from numerical simulations by Asplund et al. (2000). The solid line and rhombs: from granule (GR) with infinite spectral resolution and after convolving with FPI spectrometer curve and Hamming smoothing, respectively; dashed and asterisks: the same for intergranular (IGR) area; crosses: average observed profile scaled to the average of the calculated intensities in the wings.
Current usage metrics show cumulative count of Article Views (full-text article views including HTML views, PDF and ePub downloads, according to the available data) and Abstracts Views on Vision4Press platform.
Data correspond to usage on the plateform after 2015. The current usage metrics is available 48-96 hours after online publication and is updated daily on week days.
Initial download of the metrics may take a while.