Free Access
Fig. 9
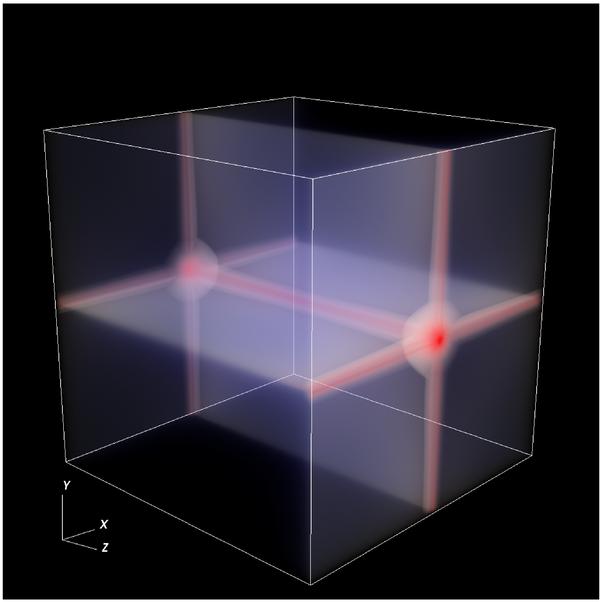
Rendering of the density field at z = 0 for three-dimensional simulation using L = 4 Mpc. Overdensities in red, underdensities in blue [See the electronic edition of the Journal for a color version of this figure.]
Current usage metrics show cumulative count of Article Views (full-text article views including HTML views, PDF and ePub downloads, according to the available data) and Abstracts Views on Vision4Press platform.
Data correspond to usage on the plateform after 2015. The current usage metrics is available 48-96 hours after online publication and is updated daily on week days.
Initial download of the metrics may take a while.