Fig. 7
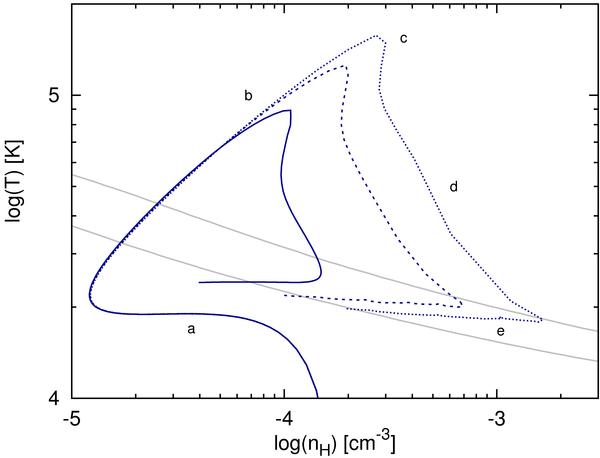
Phase space diagram, i.e., the dependence temperature versus density, is shown for the quantities at the center of the pancake. Shown are curves for L = (16,24,32) Mpc using solid, dashed, and dotted lines, respectively. The upper gray line shows equilibrium temperature at redshift of z = 0.7 (time of shock formation) and the lower gray line at z = 0. After a period of linear growth (a), the perturbation decouples from the cosmic expansion and contracts adiabatically (b) until shock formation (at the maximum of the temperature). Then, after nearly isochoric (c) and isobaric (d) evolution stages the central gas arrives at thermal equilibrium (e).
Current usage metrics show cumulative count of Article Views (full-text article views including HTML views, PDF and ePub downloads, according to the available data) and Abstracts Views on Vision4Press platform.
Data correspond to usage on the plateform after 2015. The current usage metrics is available 48-96 hours after online publication and is updated daily on week days.
Initial download of the metrics may take a while.