Fig. 2
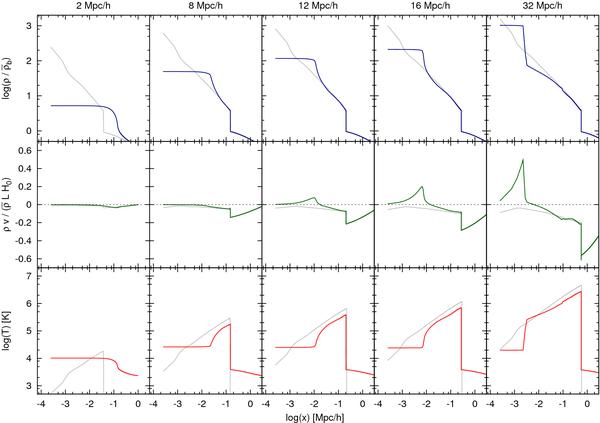
Pancake formation including cooling and heating for an initial perturbation amplitude of A = 0.02 and for a series of perturbation scales of L = (2,8,12,16,24) Mpc/h comoving. Shown is the outcome of the simulations at z = 0 including cooling and heating (solid lines), and without dissipation (gray lines). The profiles are displayed using logarithmic coordinate axes. First row: density profiles; Second row: density flux profiles; Third row: temperature profiles.
Current usage metrics show cumulative count of Article Views (full-text article views including HTML views, PDF and ePub downloads, according to the available data) and Abstracts Views on Vision4Press platform.
Data correspond to usage on the plateform after 2015. The current usage metrics is available 48-96 hours after online publication and is updated daily on week days.
Initial download of the metrics may take a while.