Fig. 24
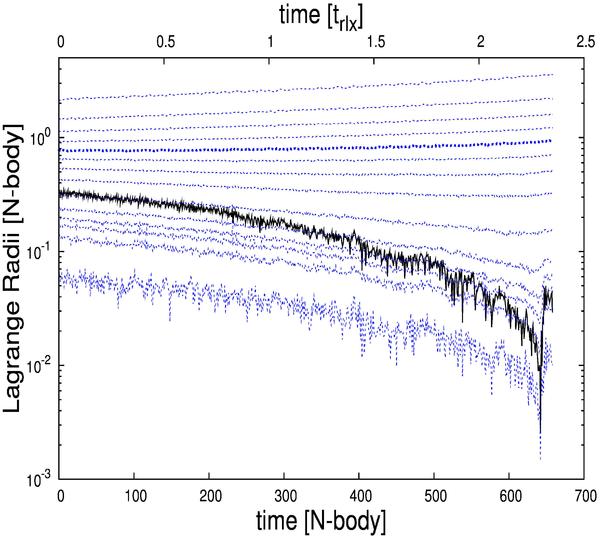
Core radius (heavy black line) and Lagrangian radii containing 90%, 80%, 70%, 60%, 50%, 40%, 30%, 20%, 10%, 5%, 3%, 2%, 1%, and 0.1% (blue dashed lines from top to bottom) of the total mass. The half-mass radius is indicated by a heavier blue dashed line. The initial condition was a Plummer model of 16 384 stars. A Salpeter mass function with mass limits mlower = 0.5 M⊙ and mupper = 5 M⊙ was chosen as the initial mass function. Core collapse is reached at tcc ≃ 634 N-body time units or tcc ≃ 2.2trlx. The simulation ended at t ≃ 660 N-body time units and took ~5 days.
Current usage metrics show cumulative count of Article Views (full-text article views including HTML views, PDF and ePub downloads, according to the available data) and Abstracts Views on Vision4Press platform.
Data correspond to usage on the plateform after 2015. The current usage metrics is available 48-96 hours after online publication and is updated daily on week days.
Initial download of the metrics may take a while.