Fig. 22
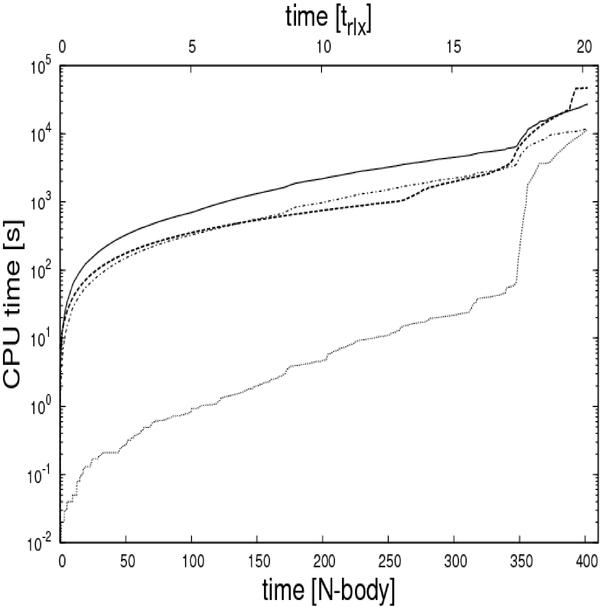
CPU time for the simulation as a function of simulation time. The continuous line is the total CPU time of Myriad, while the heavy dashed line is the total CPU time of Starlab. The dashed-dotted line shows the CPU time taken for the force calculation and neighbor list creation done on GRAPE-6. The dotted line is the CPU time required for the evolution of binary systems.
Current usage metrics show cumulative count of Article Views (full-text article views including HTML views, PDF and ePub downloads, according to the available data) and Abstracts Views on Vision4Press platform.
Data correspond to usage on the plateform after 2015. The current usage metrics is available 48-96 hours after online publication and is updated daily on week days.
Initial download of the metrics may take a while.