Fig. A.2
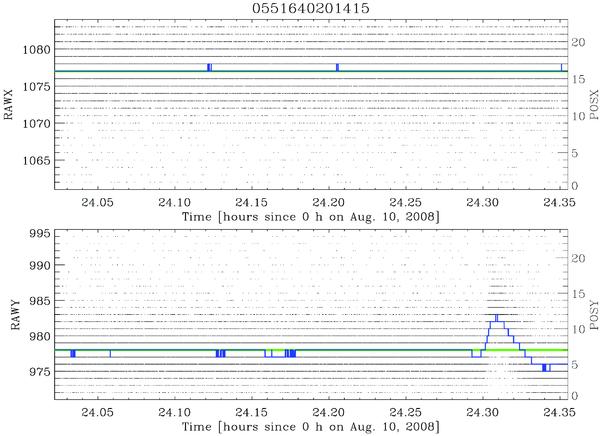
OM fast-mode window positions versus arrival times of UV photons detected during the S415 exposure. The top and bottom panel are the scattered plot of the positions of the UV photons detected by the optical monitor on the x and y-axis of the fast-mode window, respectively, versus the frame times corresponding to the photon arrival times. The left and right axis give the detector and the fast window coordinates, respectively. The green line show the median position during the exposure. The blue line shows the moving median position versus time computed on a set of frames containing at least 500 photons. (This figure is available in color in electronic form.)
Current usage metrics show cumulative count of Article Views (full-text article views including HTML views, PDF and ePub downloads, according to the available data) and Abstracts Views on Vision4Press platform.
Data correspond to usage on the plateform after 2015. The current usage metrics is available 48-96 hours after online publication and is updated daily on week days.
Initial download of the metrics may take a while.